The Reports space in Mosaic gives you access to 17 different reports covering everything from workload forecasting and budget tracking to utilization analysis and schedule variance. Each report draws from your work plans, timesheets, and project budgets to provide real-time insight into how your team and projects are performing.
Reports connect directly to the data you enter in other Mosaic spaces — Workload, Planner, Budget, and Home. The more consistently your team plans and logs time, the more powerful these reports become. The Dashboard space extends reporting by letting you pin key report widgets to a shared view for quick daily monitoring.
This is the best place to go when you want to answer questions like:
How much capacity does my team have over the next 30 days?
Are any projects trending over budget?
How does our planned time compare to what we actually spent?
What is each team member's billable utilization rate?
Do we need to hire for a specific role based on demand?
Which phases are consistently running longer than scheduled?
The Reports space is accessed from the left sidebar. When you open it, all 17 reports are listed with the permission levels required for each.
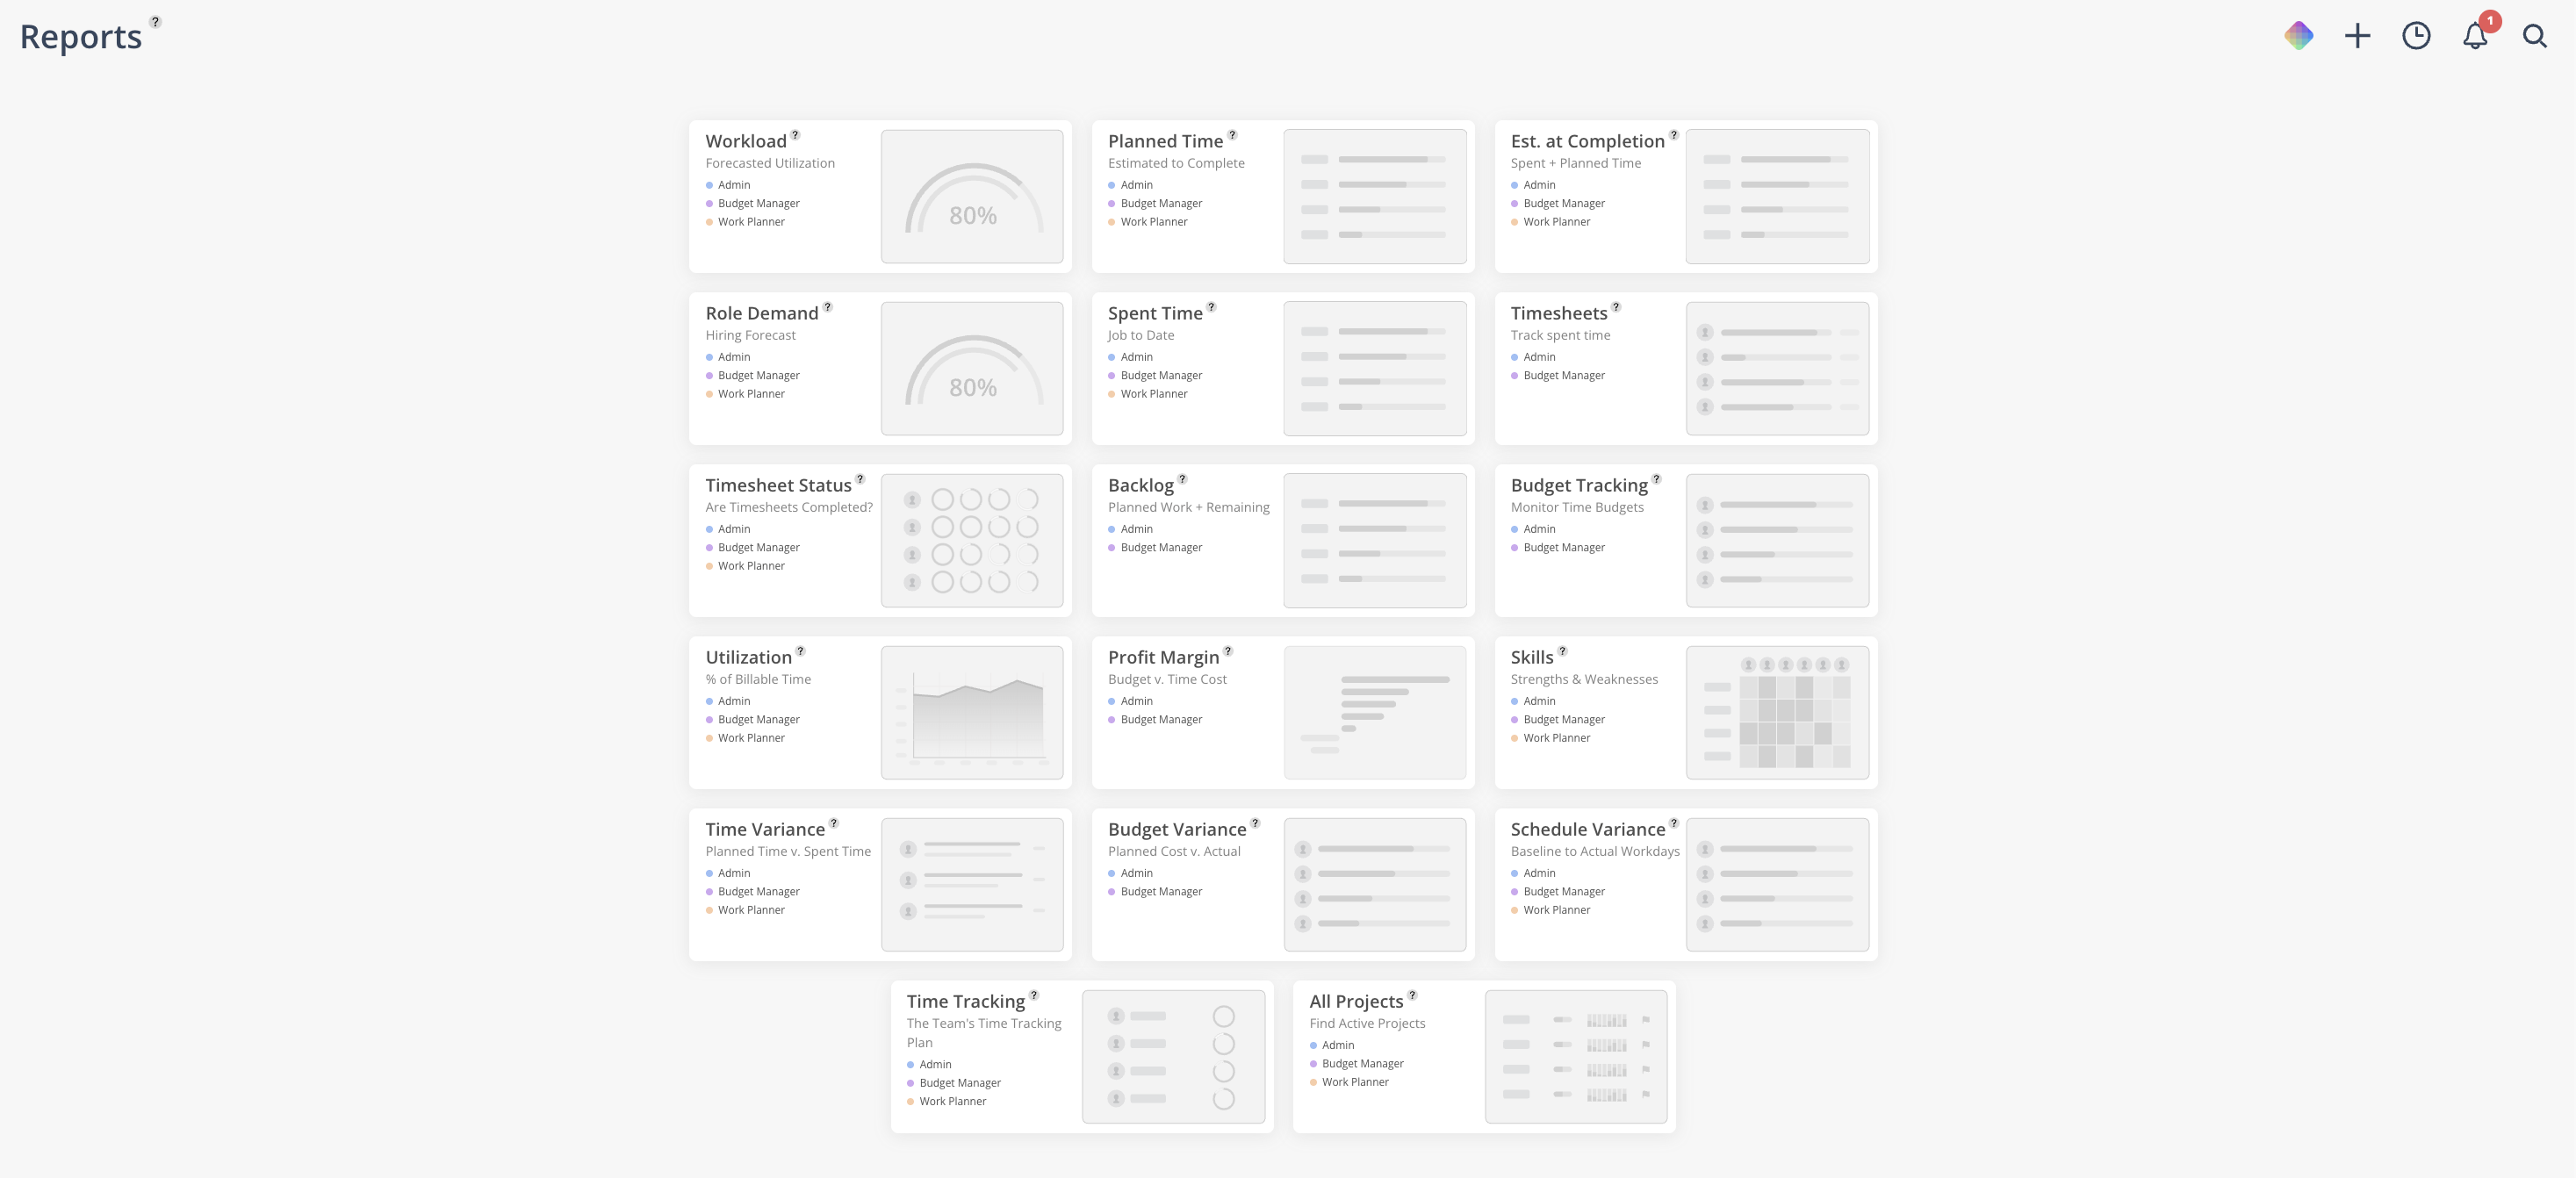
Every report shares common controls — view tabs, filters, export options, and visual indicators. Learn these once and you can navigate all 17 reports confidently.
Switch between Member, Project, Client, and Team views using the tabs at the top
Use the filter icon to narrow results by department, role, or office
Toggle between Currency and Hours, and choose your Bill Rate type
Use the eye icon to hide zero-value rows and clean up your view
Click the $ icon to jump directly to any project's Budget space
Export via the three-dot menu (Print Page on all reports; CSV download on select reports)
👉 Learn more about Navigating the Reports
View your team's forecasted utilization — planned hours compared to capacity — across members, projects, clients, or teams.
See who is over or under capacity at a glance
Toggle color-coded view to see project distribution per member
Identify staffing gaps with the team chart view
[Add image: Workload Report in member view showing capacity bars with color-coded project toggle enabled]
👉 Learn more about Workload Report
See total planned hours or dollars from today forward for members or projects.
Toggle between hours and currency
Break down to phase and individual member level
Hide zero-value rows with the eye icon
👉 Learn more about Planned Time Report
Combines spent time with future planned time to show where each project will land at completion.
View by month to see spent vs. planned breakdown
Link directly to the Budget space from any project
Identify projects on track to go over budget
👉 Learn more about Estimate at Completion Report
Forecast demand for specific roles based on current work plans and team capacity.
See if planned time exceeds capacity for any role
View in FTE equivalents for hiring decisions
Toggle tentative and open role hours on or off
👉 Learn more about Role Demand Report
Review historical time entries across projects and members.
View by project or member
Toggle between hours and currency
Break down to phase and individual level
👉 Learn more about Spent Time Report
View detailed time entries with project, phase, category, description, and hours for each member.
Filter by date range, member, or project
Delete or edit individual time entries directly
Download to CSV for external analysis
👉 Learn more about Timesheet Report
Monitor which team members have completed their timesheets for the month.
See incomplete entries highlighted in red
Send notification reminders to individual members
Set recurring weekly reminders via email and in-app message
👉 Learn more about Timesheet Status Report
See what is planned for your projects and whether those plans exceed budget.
Red exclamation marks indicate over-budget projections
View by project to see planned time per phase
View by member to see all planned work across projects
👉 Learn more about Backlog Report
Compare spent time, planned time, and budget across multiple projects in one view.
Toggle between Estimate at Completion and Remaining views
Switch between hours and currency
Link directly to a project's Budget space
👉 Learn more about Time Budget Tracking Report
Measure billable vs. non-billable time for each team member based on historical time entries.
Color-coded toggle shows project distribution
View utilization percentage per member
Filter by date range to compare periods
👉 Learn more about Utilization Report
See the profit margin for each project based on fee, budget, and spent time.
Available for projects at any status (not just completed)
Red indicators show projects in the negative
Toggle on to see over-budget/over-fee status
👉 Learn more about Profit Margin Report
Compare planned vs. actual across time, dollars, and schedule duration.
Time Variance: planned hours vs. spent hours per member or project
Budget Variance: planned dollars vs. spent dollars
Schedule Variance: planned phase duration vs. actual duration in days
👉 Learn more about Time Variance Report, Budget Variance Report, Schedule Variance Report
Additional reports for team skills tracking and a portfolio-wide project overview.
Skills Report: rank members 1–5 on custom skill categories
All Projects Report: see activity indicators, priority flags, and status for all projects at once
👉 Learn more about Skills Report, All Projects Report
Pin report widgets to a shared dashboard for quick daily monitoring without re-filtering.
Create multiple dashboards for different teams or purposes
Drag and drop widgets to reorder
Share dashboards with leadership or specific team members
👉 Learn more about Dashboards
Plan further ahead — Reports are most useful when work plans extend at least 30 days out, not just the current week
Set default roles — Assign default roles to members in admin settings so the Role Demand report populates correctly
Use dashboards for daily check-ins — Pin your most-used reports as widgets to save time re-filtering
Look proactively, not reactively — Use the 30-day and 3-month views to identify capacity issues before they become problems
Keep data clean — Remove sample project data and ensure budgets are entered for all active projects