The Timesheet Report is the most granular view of spent time data in Mosaic. It provides four different perspectives on the same time entry data, each organized differently depending on what you need to review. You can edit, delete, and export entries directly from this report.
Users can also manually enter time directly in this report. If your organization is integrated with an ERP, time entries synced from the ERP will also display here automatically.
Use the Timesheet Report when you need to answer: "What exactly did each person log their time to, and is anything incorrect?" This is the report for reconciling imported timesheets, catching errors in individual entries, verifying category and description accuracy, reviewing approval status, tracking deleted entries, or exporting raw time data to an external system.
Status Gauge (top right)
The donut chart breaks down total hours by approval status:
Dark blue = Entered
Light blue = Submitted
Green = Approved
Red = Rejected
Total Hours = sum across all statuses
Status checkboxes next to the gauge let you toggle which statuses to include in the view.
Controls
Filter icon — narrow results by specific criteria
Three-dot menu — Print Page and CSV export options
Date range selector — filter to a specific time window
This report has 4 views: Date, Member, Project, Activity. Each view shows the same underlying data organized from a different starting point.
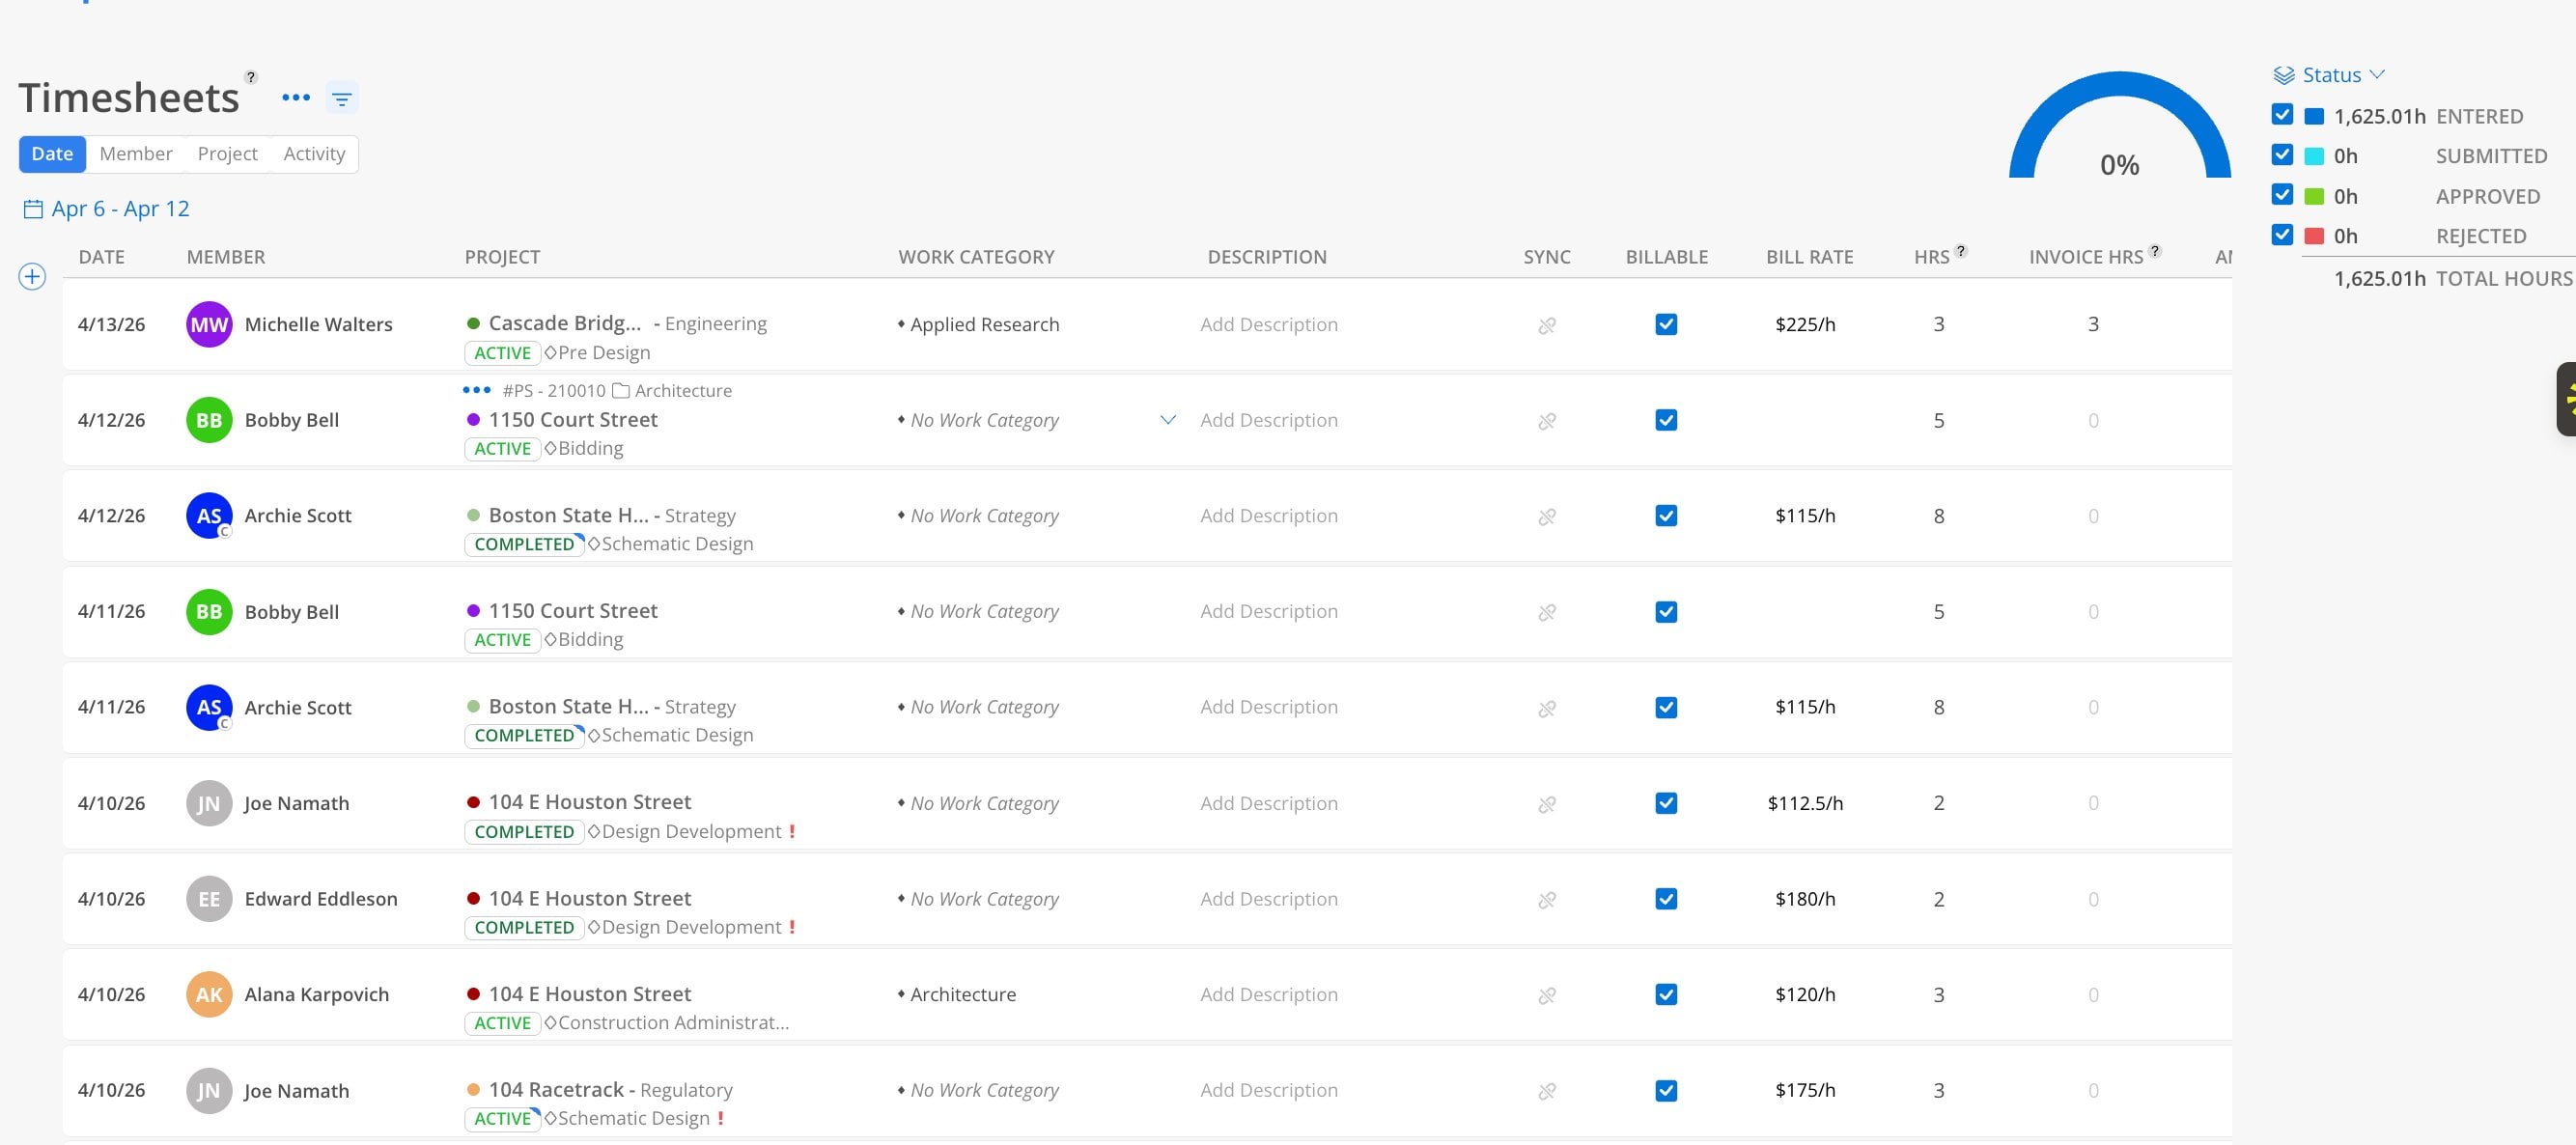
The Date view shows every individual time entry as a flat list sorted by date.
Click the Date tab at the top.
Select a date range.
Review individual entries sorted chronologically.
Each row shows: Date, Member, Project (with status, phase, and project type), Work Category, Description, Sync icon, Billable checkbox, Bill Rate, Hours, and Invoice Hours.
Sync icon (green) — appears in the Sync column when the entry has been synced from your ERP integration. A gray icon means the entry has not been synced.
Red exclamation mark on a phase name indicates the time entry falls outside the phase dates.
Work Category dropdown — click to assign or change the work category for an entry.
Add Description — click to add or edit the description for any entry.

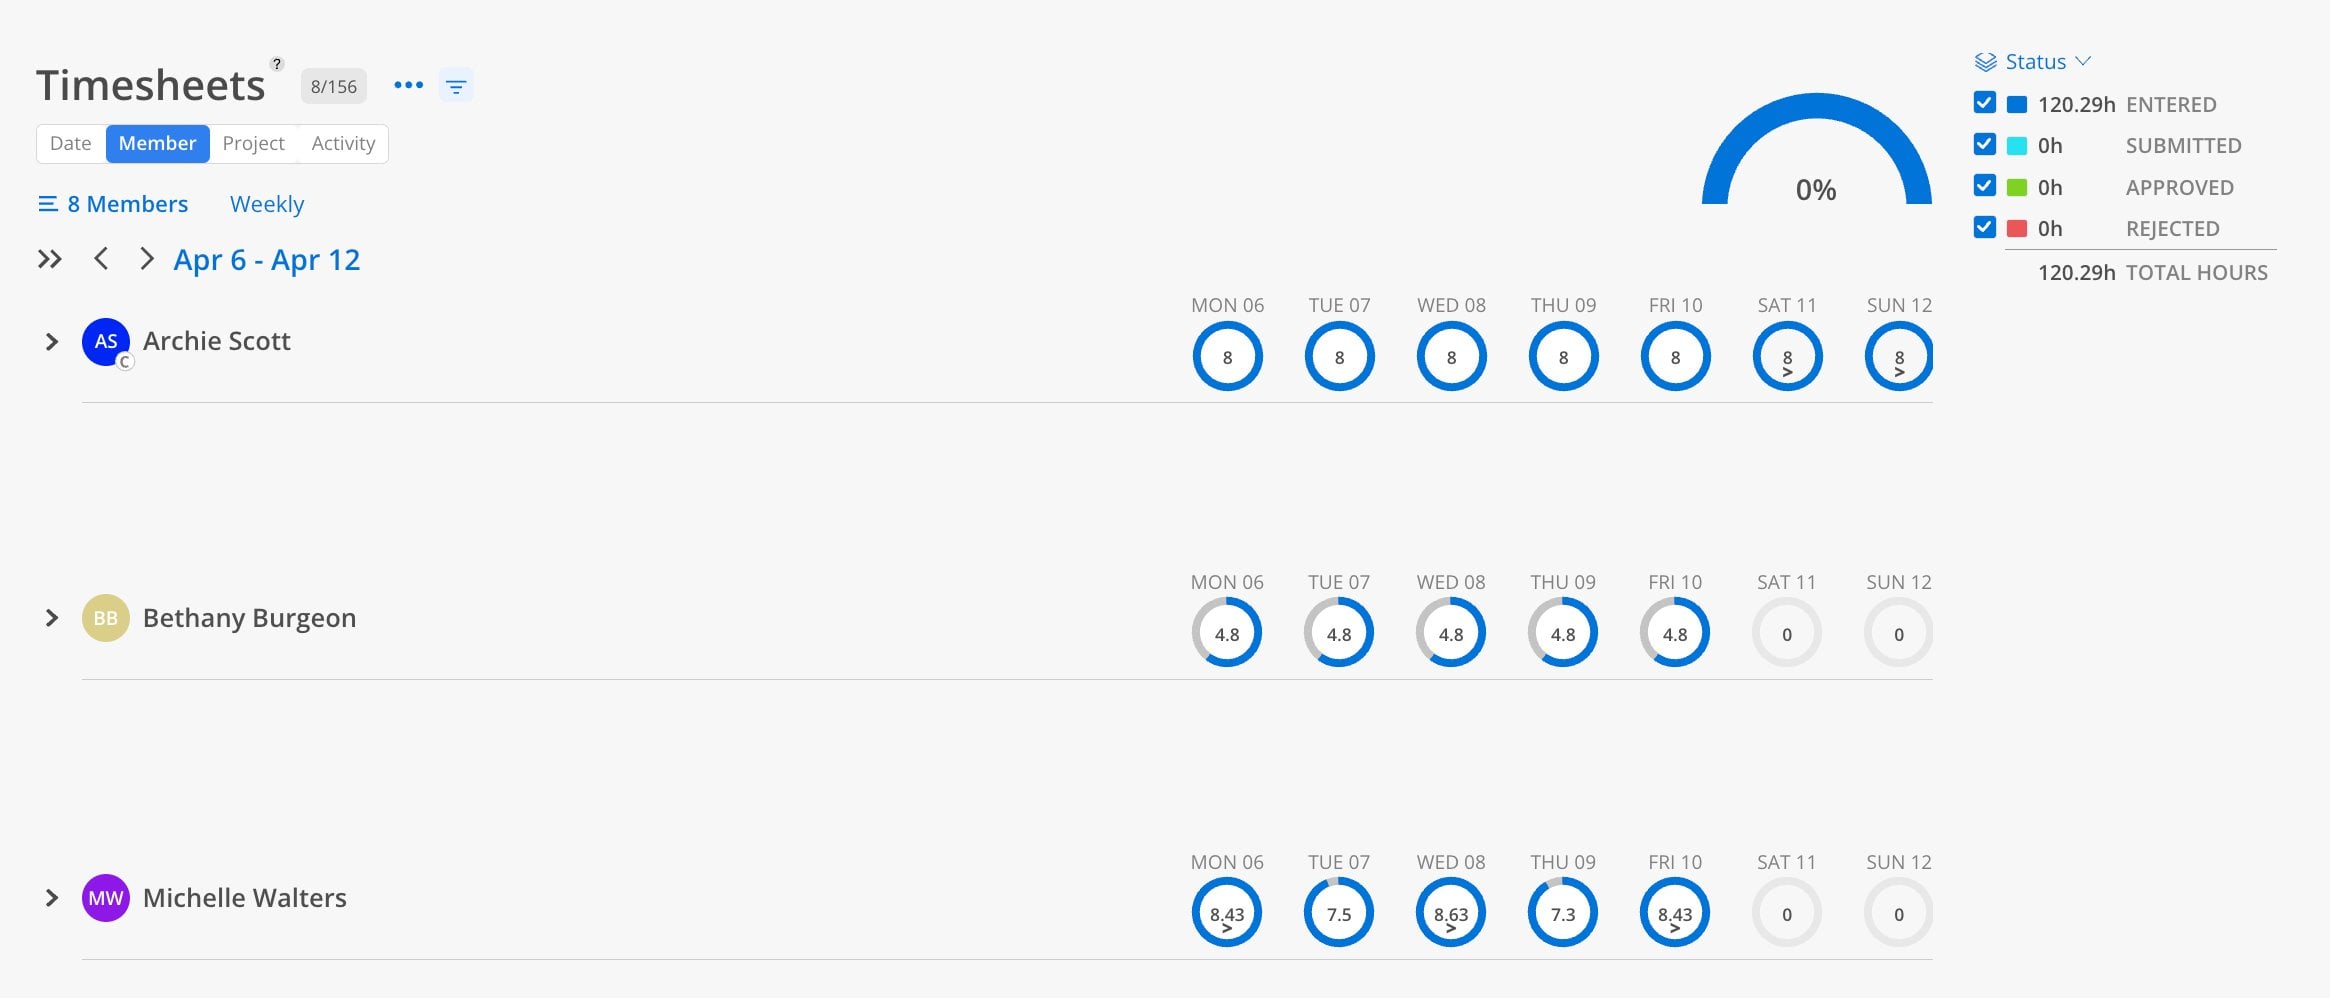
The Member view shows a weekly calendar grid with daily hour totals per team member.
Click the Member tab at the top.
Select members.
Choose a week using the date navigation arrows.
Each member row displays a circle for each day of the week (Mon–Sun). The circle fills proportionally based on hours entered — a full circle indicates a full day logged. Hour values appear inside each circle.
Expand a member to see the individual time entries that make up their daily totals.
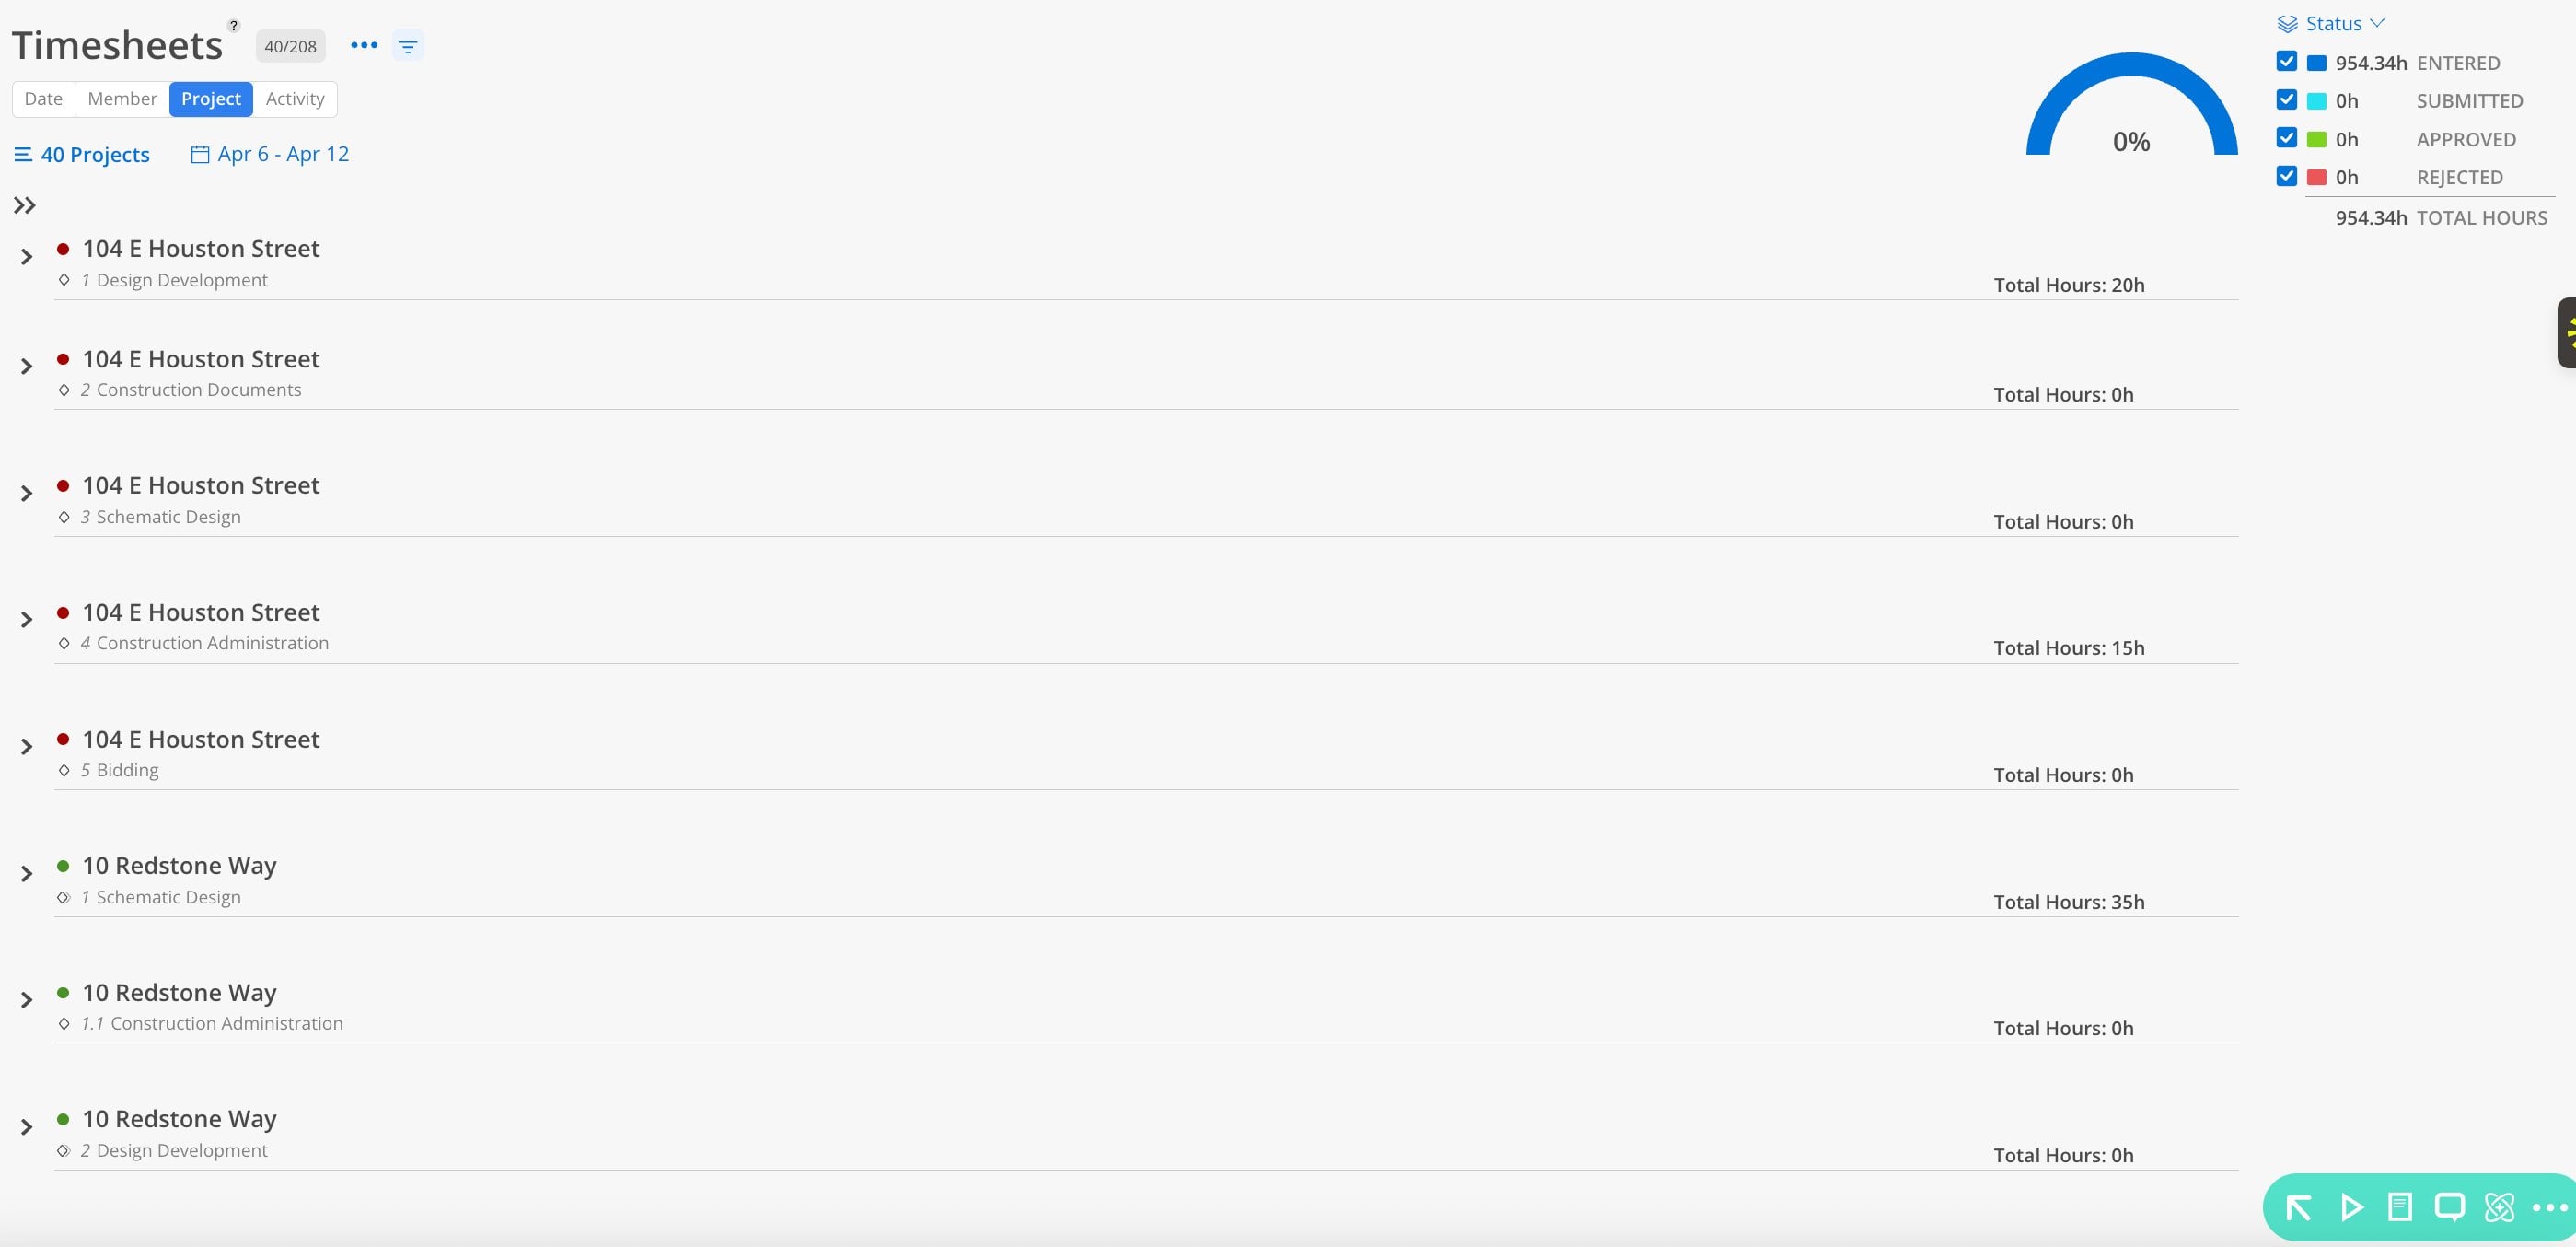
The Project view shows time entries organized by project and phase.
Click the Project tab at the top.
Select projects and a date range.
Review total hours per project and phase.
Each row shows a project with its phase underneath, along with Total Hours for that phase during the selected period. Expand a phase to see individual member entries.
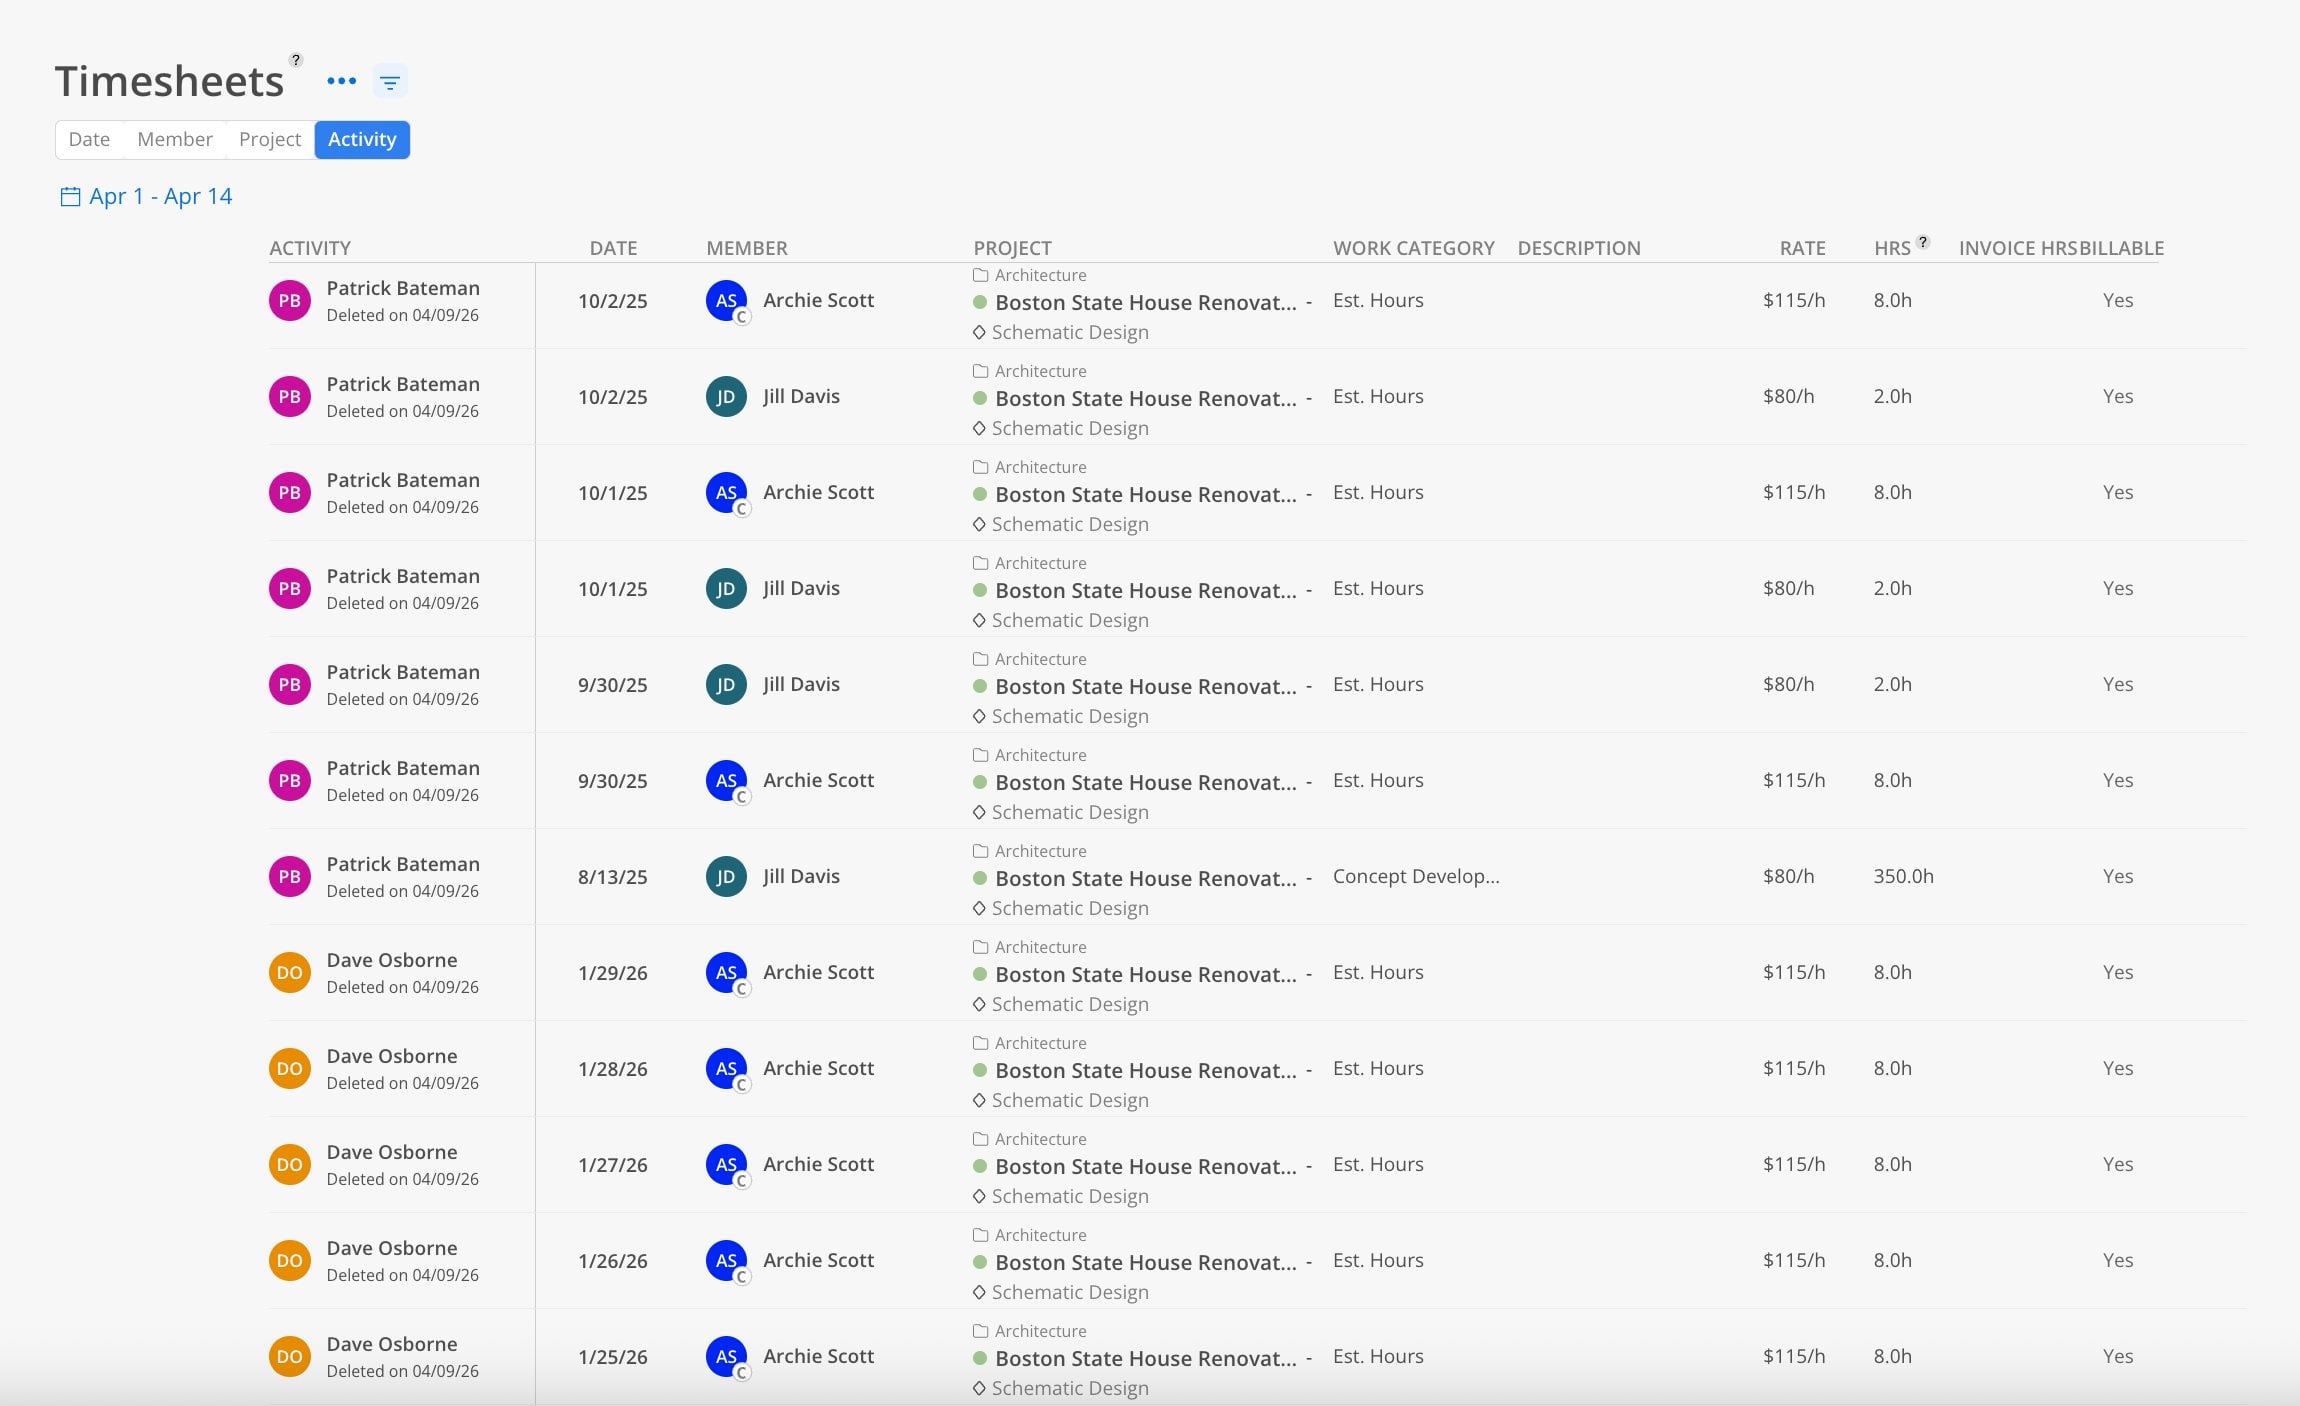
The Activity view shows a log of timesheet actions — including deleted entries — with full audit detail.
Click the Activity tab at the top.
Select a date range.
Review the activity log sorted by date.
Each row shows: Activity (who performed the action and when, e.g., "Deleted on 04/09/26"), Date of the time entry, Member, Project (with phase), Work Category, Description, Rate, Hours, Invoice Hours, and Billable status.
This view is especially useful for tracking deleted time entries and understanding who made changes.
Navigate to the Date view for the most detailed entry-level access.
Click on any field (Work Category, Description, Hours) to edit it directly.
To delete an entry, use the options on the entry row.
Refresh the page to see updated totals.
To delete entries for a specific project in bulk, use the Project view and filter to the project, then delete from there rather than going person by person.
Click the three-dot menu at the top right.
Select CSV to download the timesheet data as a spreadsheet.
The Timesheet Report is one of the few reports that supports CSV download. Most other reports only support print/PDF.
Use the Date view for detailed review — It shows every column including bill rate, invoice hours, and billable status in a flat list that is easy to scan.
Use the Member view for weekly check-ins — The circle visualization makes it easy to spot who has not logged a full week.
Use the Activity view to track deletions — If entries were deleted, the Activity view shows who deleted them and when.
Red exclamation marks are informational — They indicate a time entry is outside the phase dates but do not prevent submission.