Dashboards are an extension of the Reports space. They let you pin report widgets — small-scale versions of reports — so you can monitor key data without re-filtering each report individually. Dashboards are shared views that can be created, edited, and shared with specific team members.
Use Dashboards when you need to answer: "What does my team's status look like right now — without opening five different reports?" Dashboards are your daily landing page for monitoring. Set them up once with the reports you check most often, and they stay updated automatically. Use them during weekly meetings to present data without scrambling to filter reports in real time.
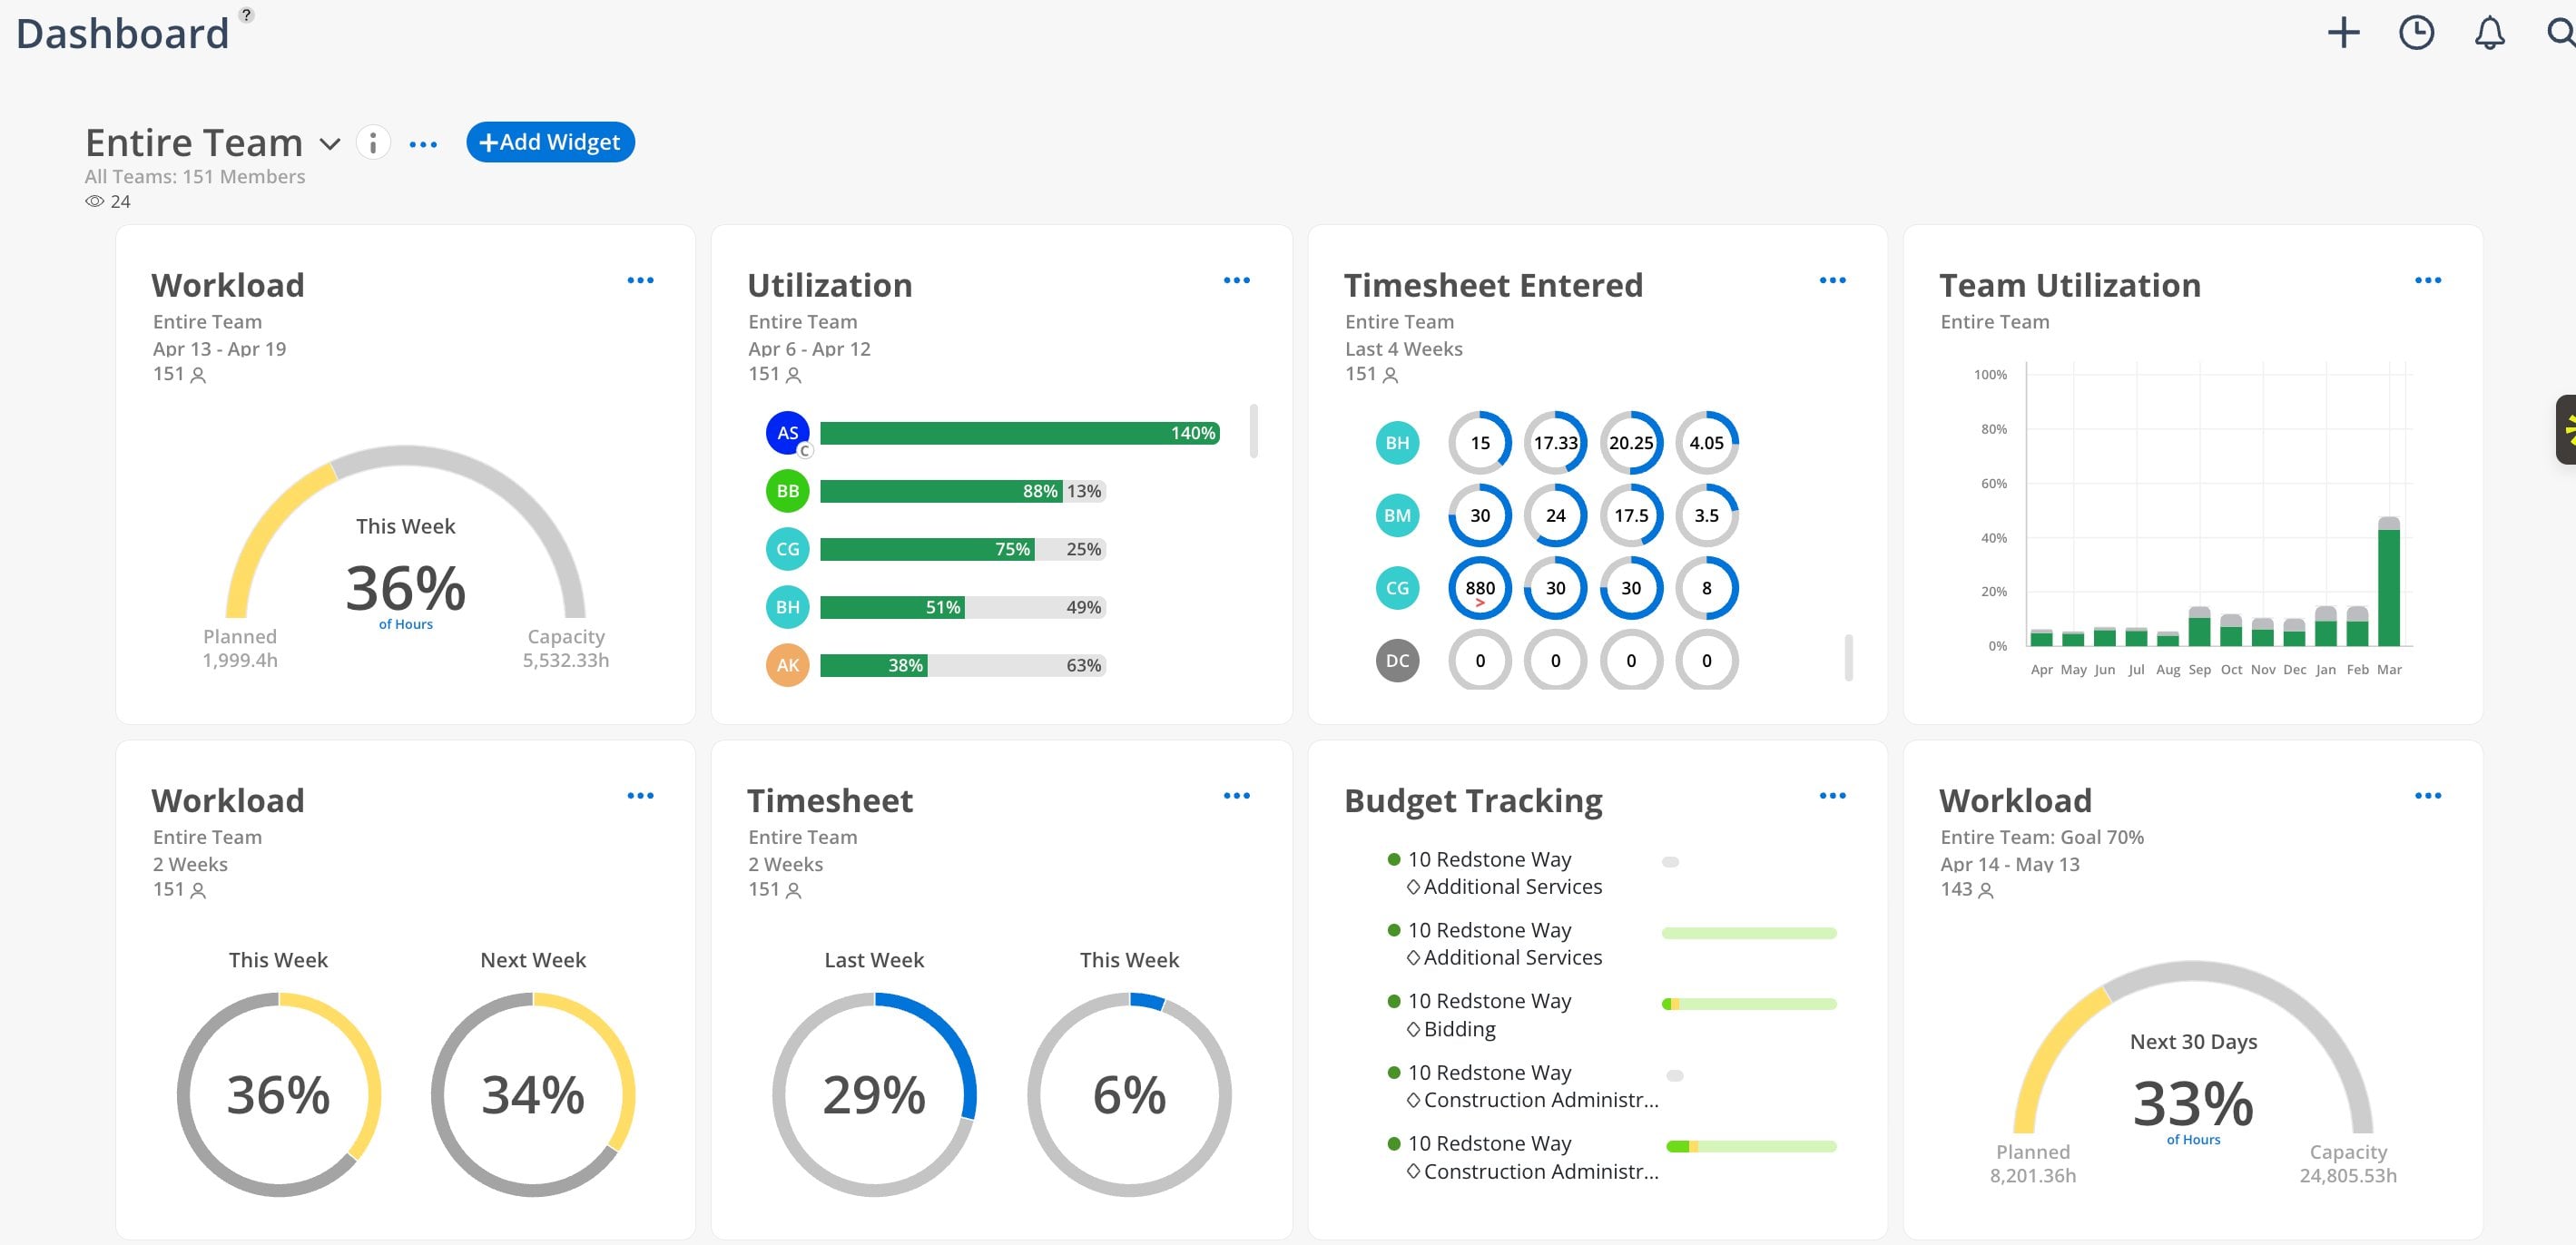
Dashboard Layout
Widget cards — each widget displays a small-scale version of a report with its own title, team, date range, and data visualization
Drag-and-drop — rearrange widgets in any order
Controls
Team selector (top left) — choose which team or group the dashboard is filtered to, with member count and viewer count
+Add Widget button — opens the widget picker to add new widgets
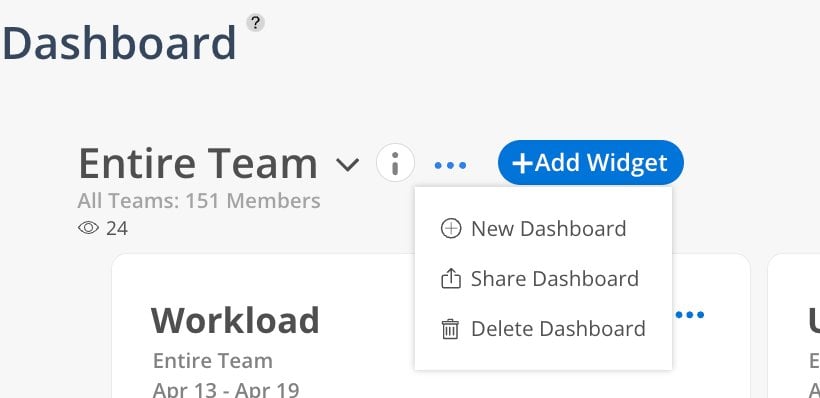
Three-dot menu (...) — New Dashboard, Share Dashboard, Delete Dashboard
Info icon (i) — dashboard description and details
Click Dashboards in the left sidebar.
Click the three-dot menu (...) and select New Dashboard.
Give it a name and description.
Click +Add Widget.
Select the widget type from the picker.
Configure the filter — select members, projects, and date range.
Click Done. The widget appears on the dashboard.
Drag and drop widgets to reorder.
Click +Add Widget to see all available widget types. Widgets are organized by report type:
Workload Summary — gauge showing planned % of capacity
Utilization Summary — gauge showing utilization % of capacity
Team Utilization Graph — monthly bar chart of team utilization trends
Team Utilization — monthly bar chart view
Timesheet — side-by-side gauges for timesheet completion
Timesheets Entered — member-level daily entry circles
Timesheets Submitted — member-level submission status
Timesheets Approved — member-level approval status
Budget Tracking — project-level budget bars
Open the dashboard.
Click the three-dot menu (...).
Select Share Dashboard.
Select team members who should have access.
Anyone with access to reports can view shared dashboards. Changes made by one person (reordering, editing widgets) affect all viewers.
Click the three-dot menu (...) on any widget card.
Adjust filters, date ranges, or members.
Add a goal or note to label the widget (e.g., "Design Team" or "Q2 Target: 75% utilization").
Click Done.
Click on any widget to expand it into the full report view.
The report opens pre-filtered based on the widget's settings.
Navigate back to the dashboard when done.
Create per-team dashboards — If you have multiple departments, create a dashboard for each so you can quickly compare teams.
Leadership dashboard — Set up a dashboard with the whole organization's workload, utilization, and budget tracking for executive meetings.
Personal dashboards — Individual team members can create their own dashboard for personal tracking.
Dashboards are shared — If someone rearranges widgets, it changes for everyone. Communicate with your team.