This report helps you determine whether you have enough staff in each role to cover planned work. It requires default roles to be set in admin settings for each member. Without default roles, the report will not populate fully.
Use the Role Demand Report when you need to answer: "Do we have enough people in each role to cover the work that is planned — and if not, do we need to hire?" This report is essential for proactive staffing decisions. Look at it 2–3 months ahead to identify roles that will be over-committed before it becomes a crisis.
The Bars
Yellow = planned hours for that role
Gray = total working capacity for members in that role
Hashed yellow = open role / placeholder planned time
Red line = planned time exceeds capacity
Controls
Role selector — choose which roles to analyze
FTE toggle — switch from hours to full-time employee equivalents
Tentative toggle — include or exclude tentative work plans
Date range selector — 30 days, 3 months, or custom
This report has 3 views: Member, Project, Team (Chart). Each view shows the same underlying data organized from a different starting point.
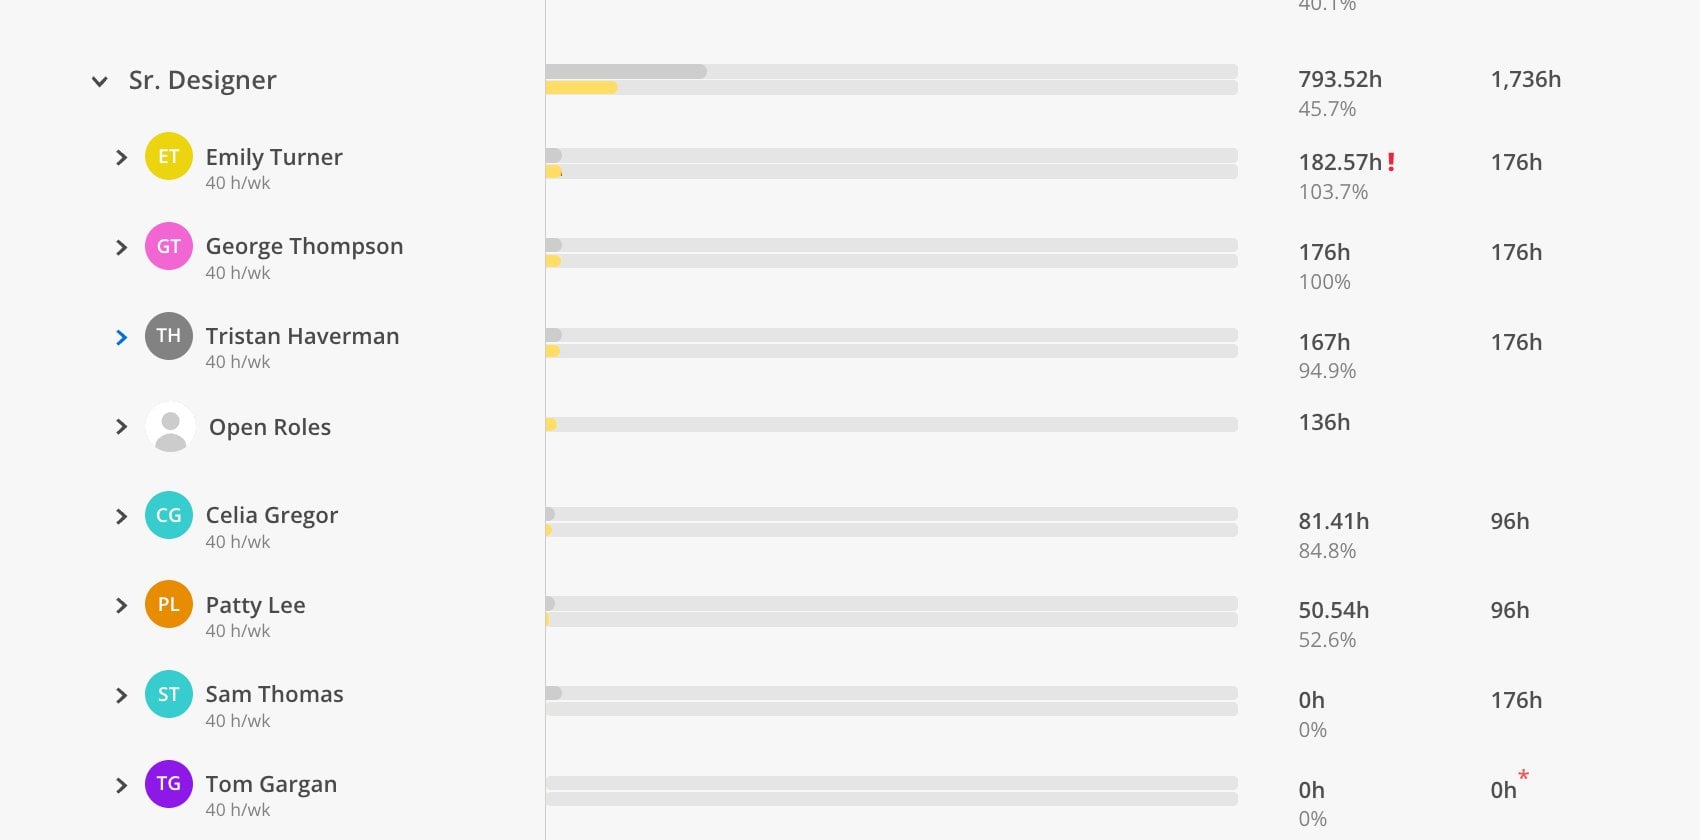
The Member view shows individual team members within each selected role.
Click the Member tab at the top.
Select roles using the role selector.
Choose a date range (30 days, 3 months, custom).
Each member in the selected role appears with their planned time vs. capacity. If any member's planned time exceeds their capacity, a red indicator appears. The Open Roles row shows any placeholder plans that have not been assigned to a specific person.
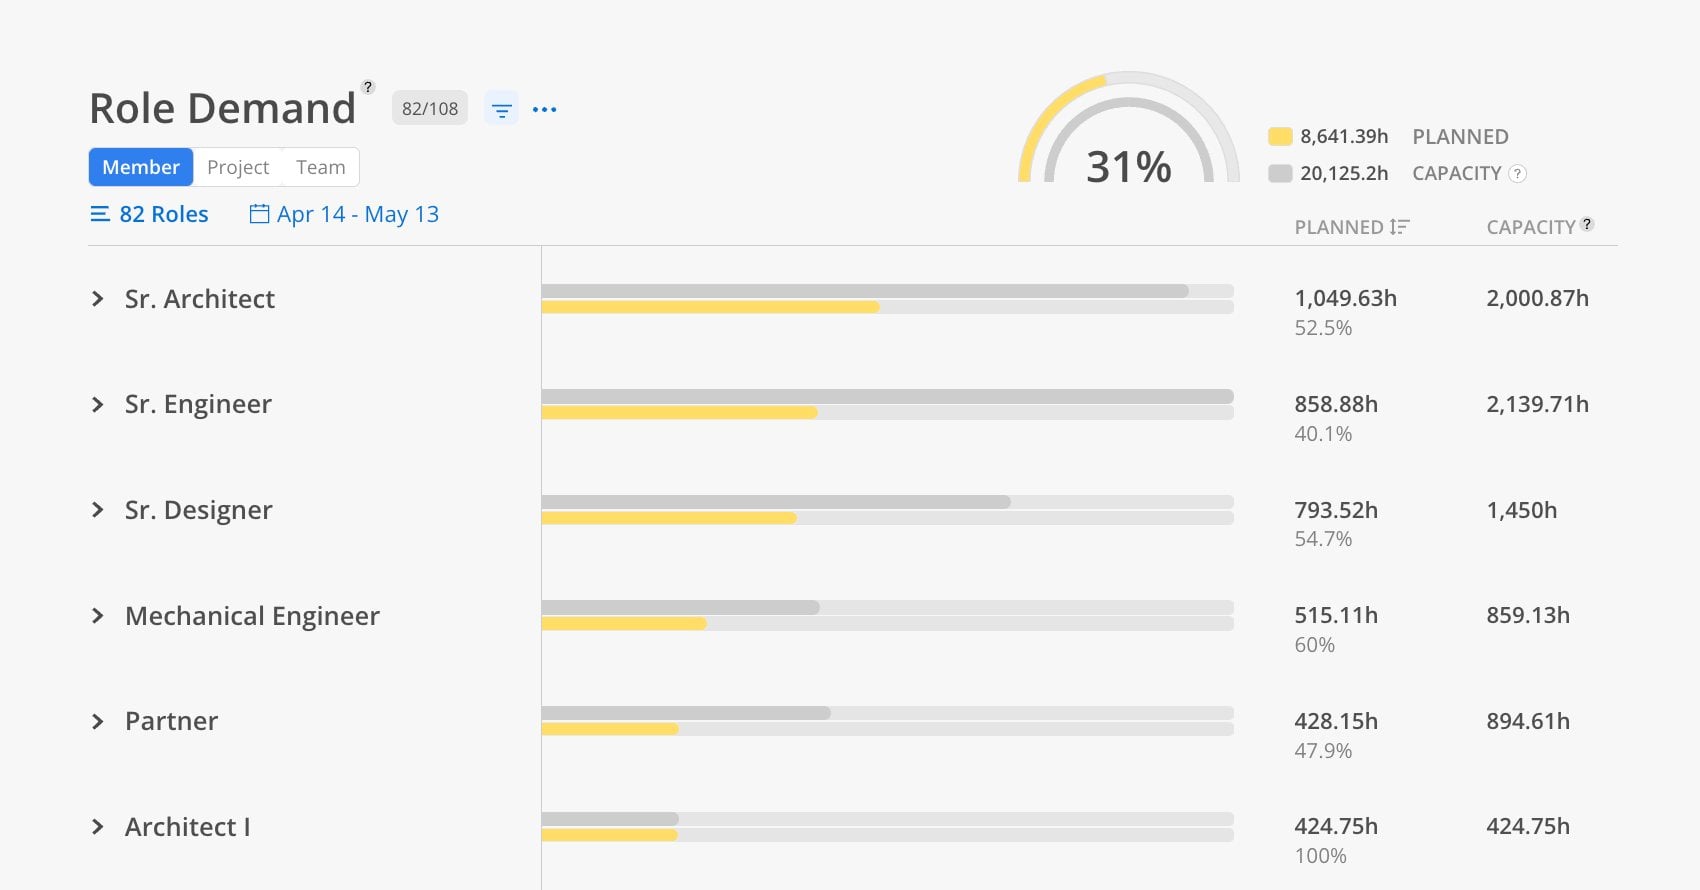
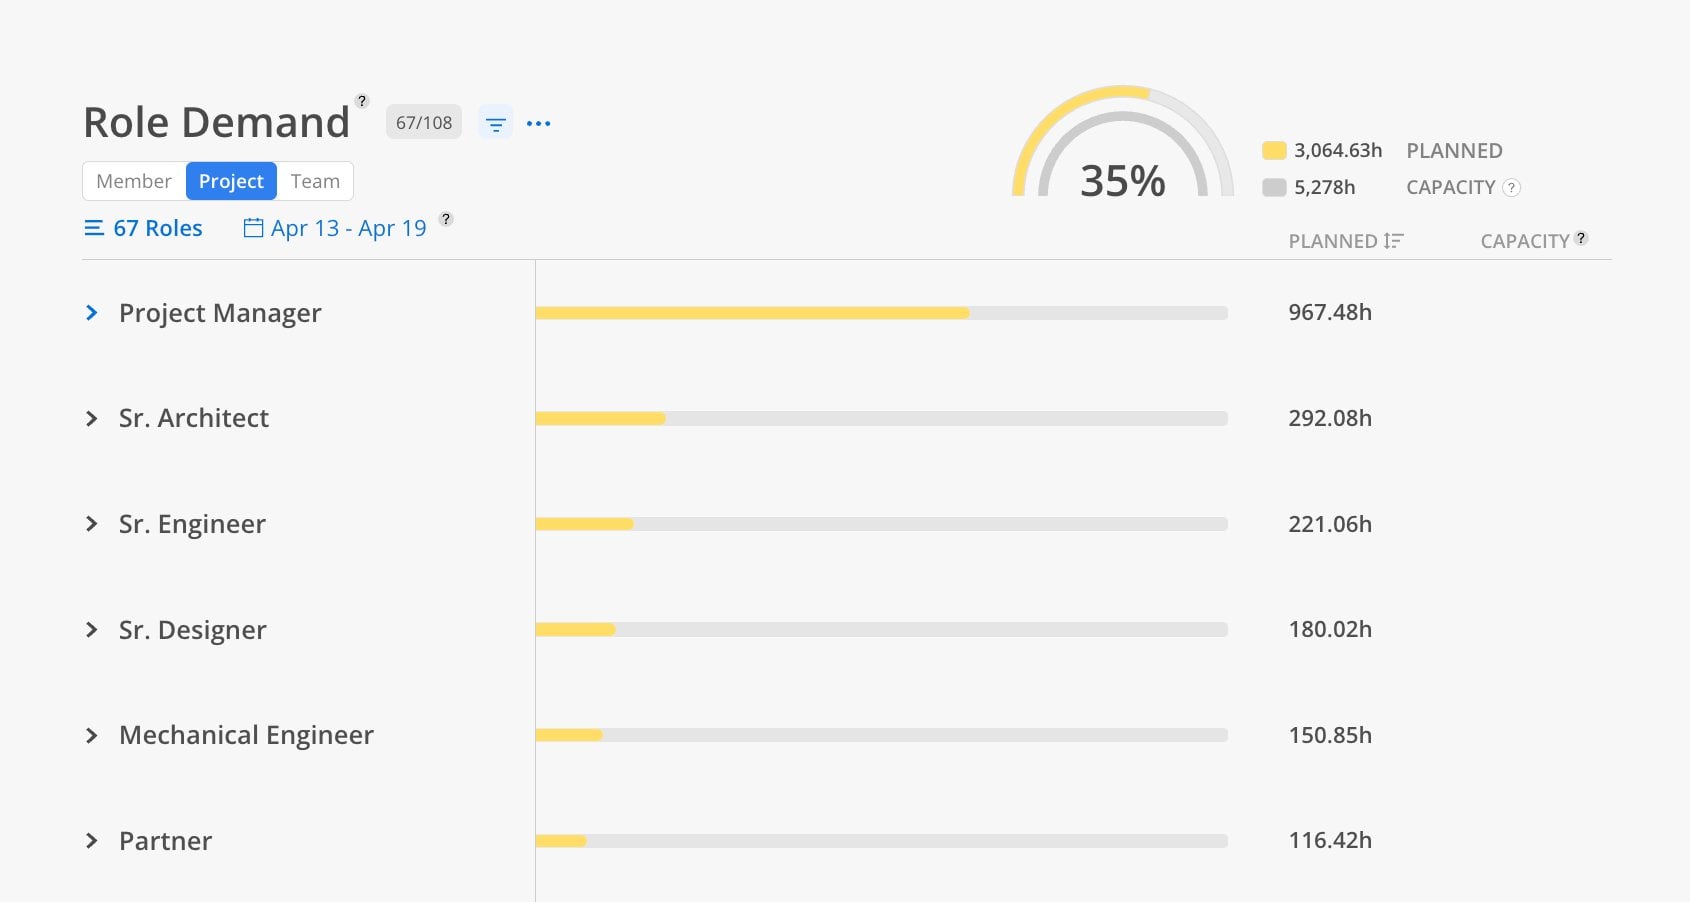
The Project view shows which projects are driving demand for each role.
Click the Project tab at the top.
Select roles.
Choose a date range.
Each project shows how many hours of that role are planned. This helps identify which projects are consuming the most capacity for specific roles.
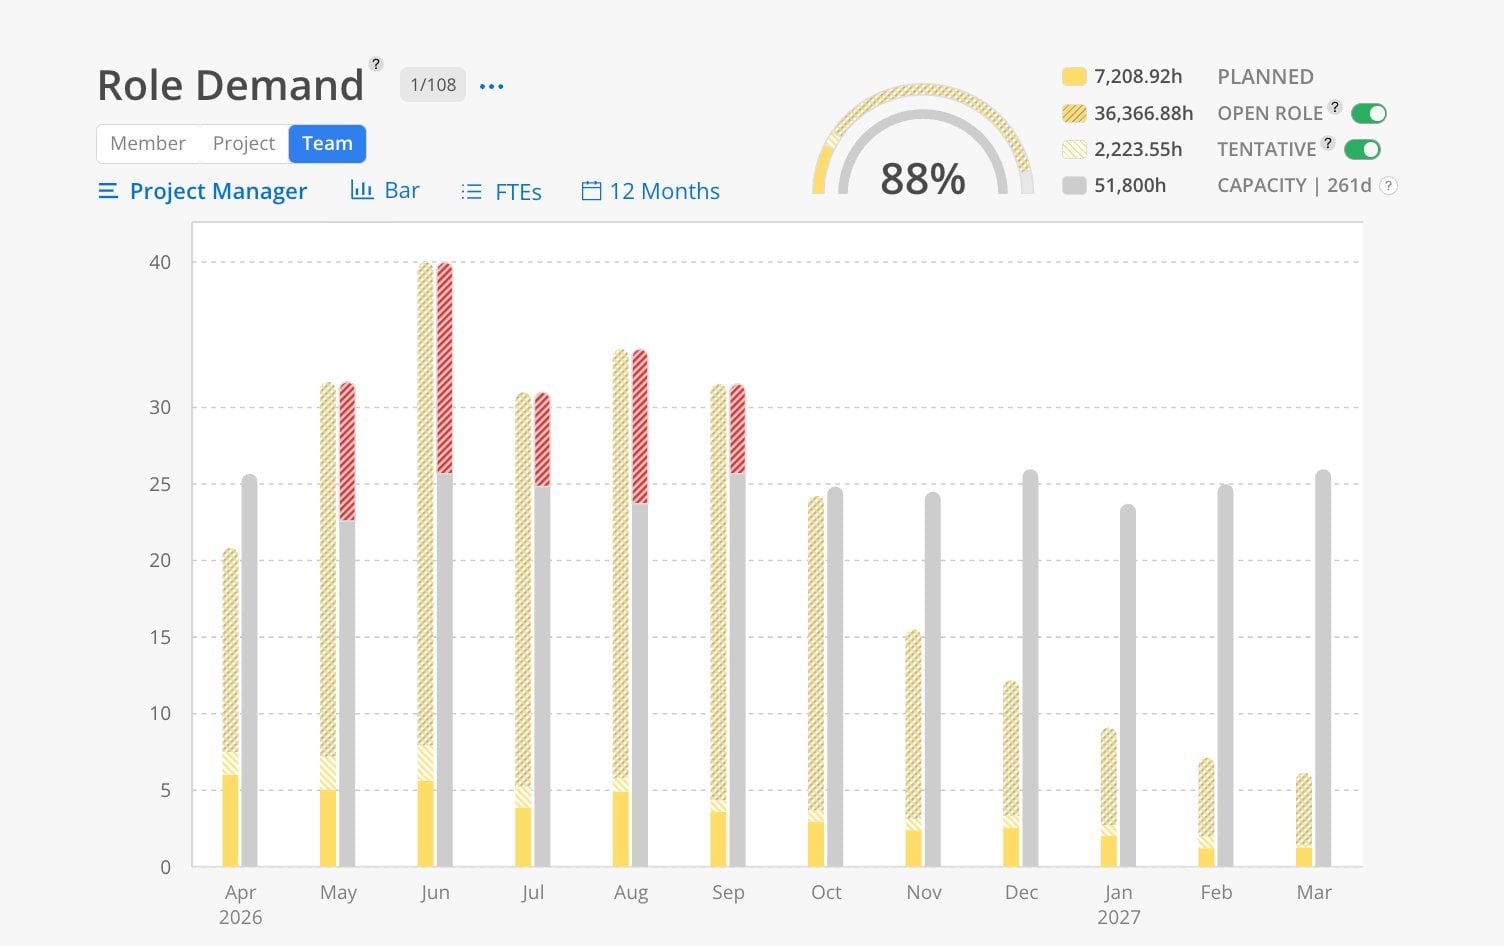
The Team view provides a chart summarizing role demand across the organization.
Click the Team tab at the top.
Select a role and choose Quarter or Annual view.
If the yellow (planned) line exceeds the gray (capacity) line, that role is over-committed.
Toggle to FTE to see how many additional employees would be needed.
Toggle tentative and open role hours on or off to adjust the calculation.
Hover over any point in the chart to see the exact hours of planned time vs. capacity. When over-committed, a red bar or line shows the overage.