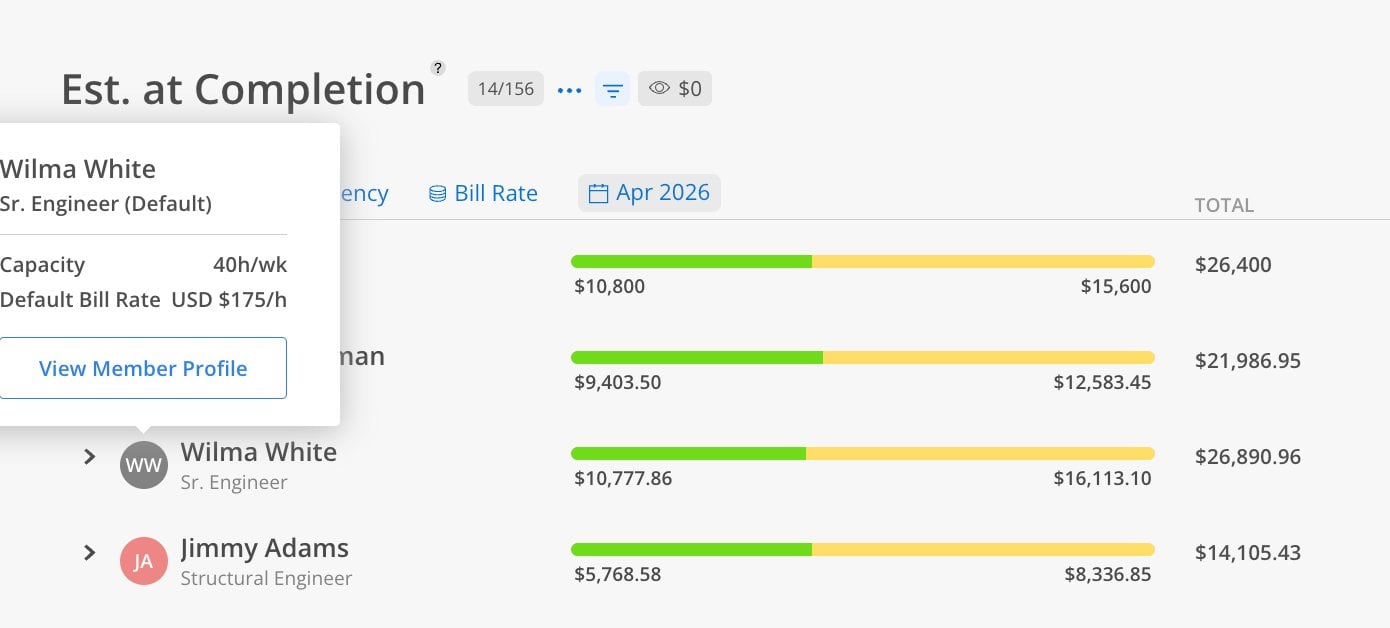
This report combines historical spent time with future planned time to show where each project will end up. It updates daily as plans change and time is logged. The dollar sign icon on each project row links directly to the Budget space for that project.
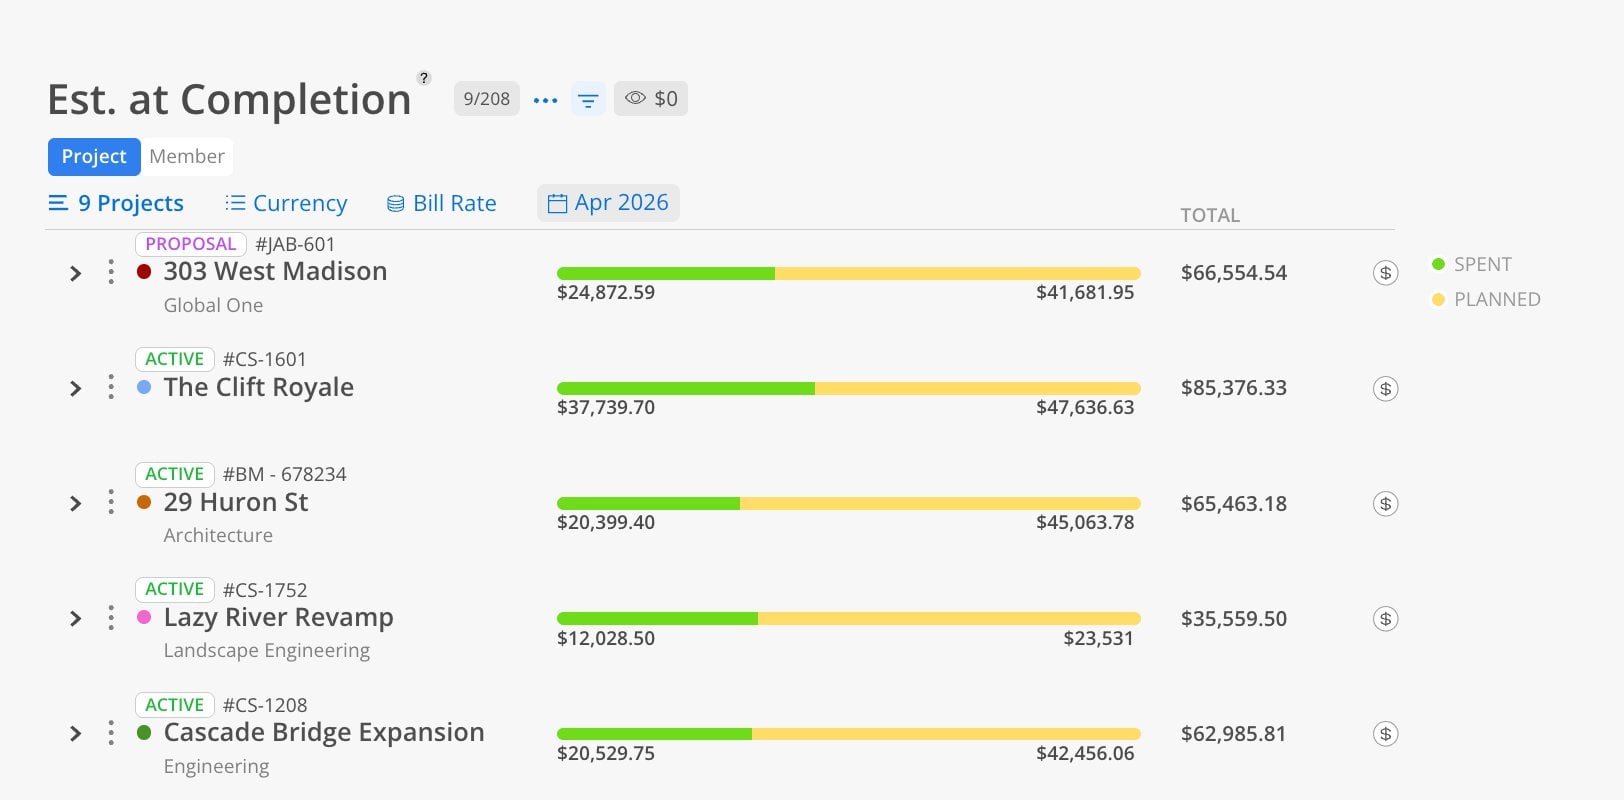
Use the Estimate at Completion Report when you need to answer: "If we keep going as planned, how much will this project cost in total — and will that be over budget?" This is the report to check when you want a combined view of what has already happened and what is still expected, especially mid-project. It is ideal for monthly project health reviews.
The Bars
Green = spent time (hours or dollars already logged)
Yellow = planned time (hours or dollars planned from today forward)
Total column = spent + planned combined
Controls
Currency / Hours toggle — switch between dollars and hours
Bill Rate dropdown — choose Rate, Bill, or Cost
Date range selector — view by month, custom range, or At Completion
Budget link ($) — jump to the Budget space for any project
This report has 2 views: Project, Member. Each view shows the same underlying data organized from a different starting point.
The Project view is the primary way to use this report.
Click Reports > Estimate at Completion.
Click the Project tab.
Select projects using the project selector.
Choose a date range (e.g., this month).
View each project's spent + planned totals.
Click the $ icon to jump to the Budget space for any project.
Expand a project to see each phase's spent and planned time. Expand further to see individual member allocations within each phase, with spent and planned dollar amounts per person.
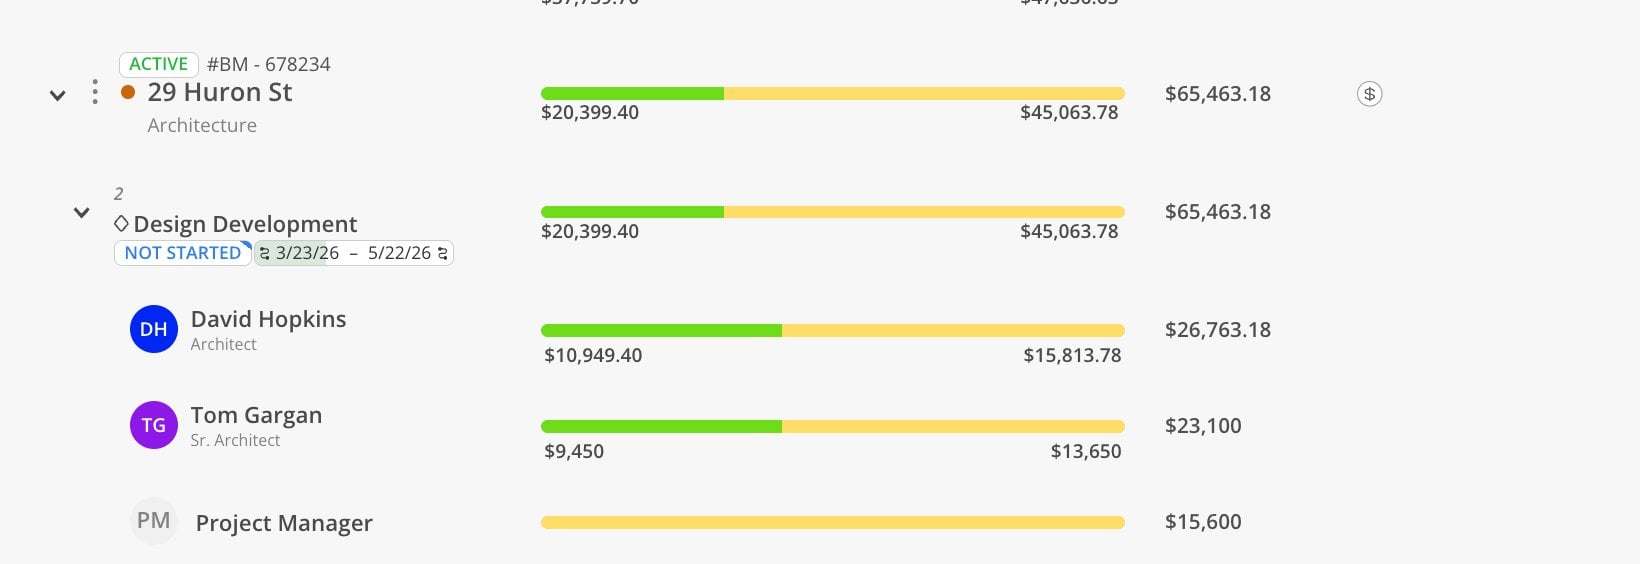
Plan time that has passed without corresponding spent time entries will fall off from the planned total. These numbers update daily.
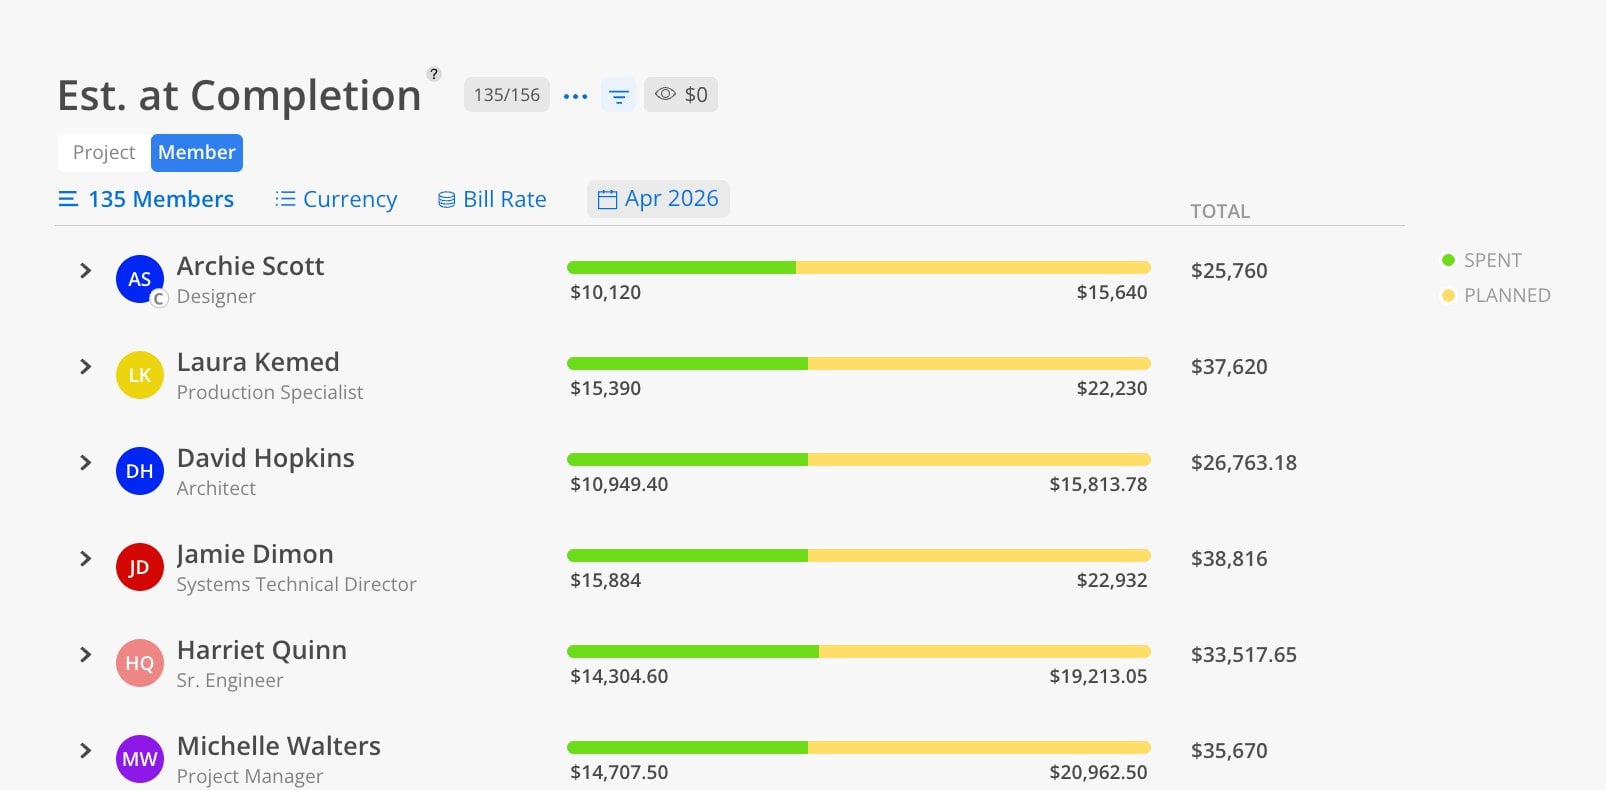
The Member view shows the same spent + planned data but starting from the member level.
Click the Member tab.
Select members.
Choose a date range.
Each member row shows their total spent + planned across all assigned projects. Expand to see which projects and phases are contributing to their totals.
Clicking on a member's name or avatar opens a profile popup showing their default role, weekly capacity, and default bill rate, with a link to view their full member profile.