This report gives you a high-level snapshot of all selected project in a table format. It is useful for identifying projects with no recent activity or no upcoming plans, setting priorities, and reviewing project status across the portfolio.
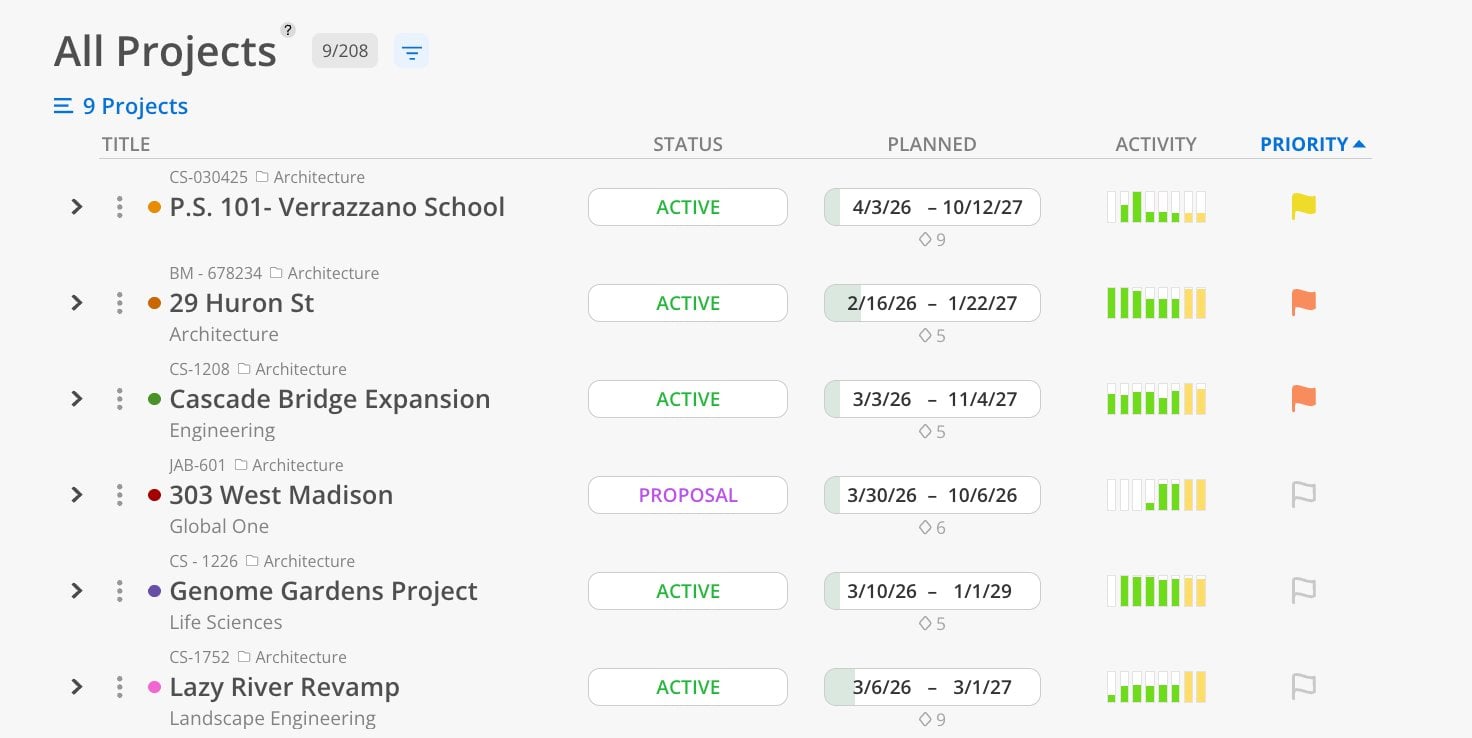
Use the All Projects Report when you need to answer: "Which projects are active, which have gone quiet, and which need attention?" This is the report to open when you want a quick health check across your entire portfolio. The activity column instantly shows where time is being spent and where plans exist — and more importantly, where both are missing. It is also the place to set and review project priority flags.
The Table
Title — project name with color dot, project number, type icon, and category
Status — Active, Proposal, Hold, or Completed badge
Planned — project date range (start – end) with phase count below (e.g., ◇ 9)
Activity — colored bar indicators: green bars = recent spent time, yellow bars = upcoming planned time
Priority — colored flag icons: red (highest), orange, yellow, or unfilled (no priority set)
Controls
Sortable column headers — click any header to sort (e.g., by Priority, Activity, or Status)
Filter icon — narrow results by specific criteria
This report is organized as a project table.
Click Reports > All Projects.
Select projects or portfolios.
Review columns for status, date range, activity, and priority.
Click any column header to sort (e.g., sort by Priority, Activity, or Status).
Set priority flags by clicking the flag icon on any project row.
The activity column contains colored bar indicators for each project:
Green bars (left side) — represent spent time for recent weeks. Taller/filled green bars mean more time was logged that week.
Yellow bars (right side) — represent planned time for upcoming weeks. Filled yellow bars mean there are work plans for that week.
If a project shows no green and no yellow bars, the project has had no recent activity and nothing planned ahead. This is a signal to investigate.
When sorting by Activity, projects are ranked by total hours from recent spent time combined with upcoming planned time. Projects with the highest total appear at the top.
Red flag (filled) — highest priority
Orange flag (filled) — high priority
Yellow flag (filled) — medium priority
Unfilled flag outline — no priority set
Priority flags are set at the project level and visible to the entire team. When you change a priority, everyone sees the change.
Sort by Activity to find gaps — Projects with no activity bars need attention — either they need plans created or they should be marked as Hold or Completed.
Sort by Priority for planning meetings — Sorting by priority puts your most important projects at the top for quick review.