This report mirrors the Budget space but lets you view multiple projects at once. It supports two view modes — Estimate at Completion (EAC) and Remaining — and lets you toggle between currency and hours, as well as between different bill rate types. The dollar sign icon on each project row links directly to the Budget space for that project.
Use the Time Budget Tracking Report when you need to answer: "Across all my projects, how does the combination of spent time and planned time compare to the budget and fee?" This is the report to use when you want a side-by-side budget comparison of multiple projects in one view, rather than clicking into each project's Budget space individually. It is ideal for portfolio-level budget reviews and financial check-ins with leadership.
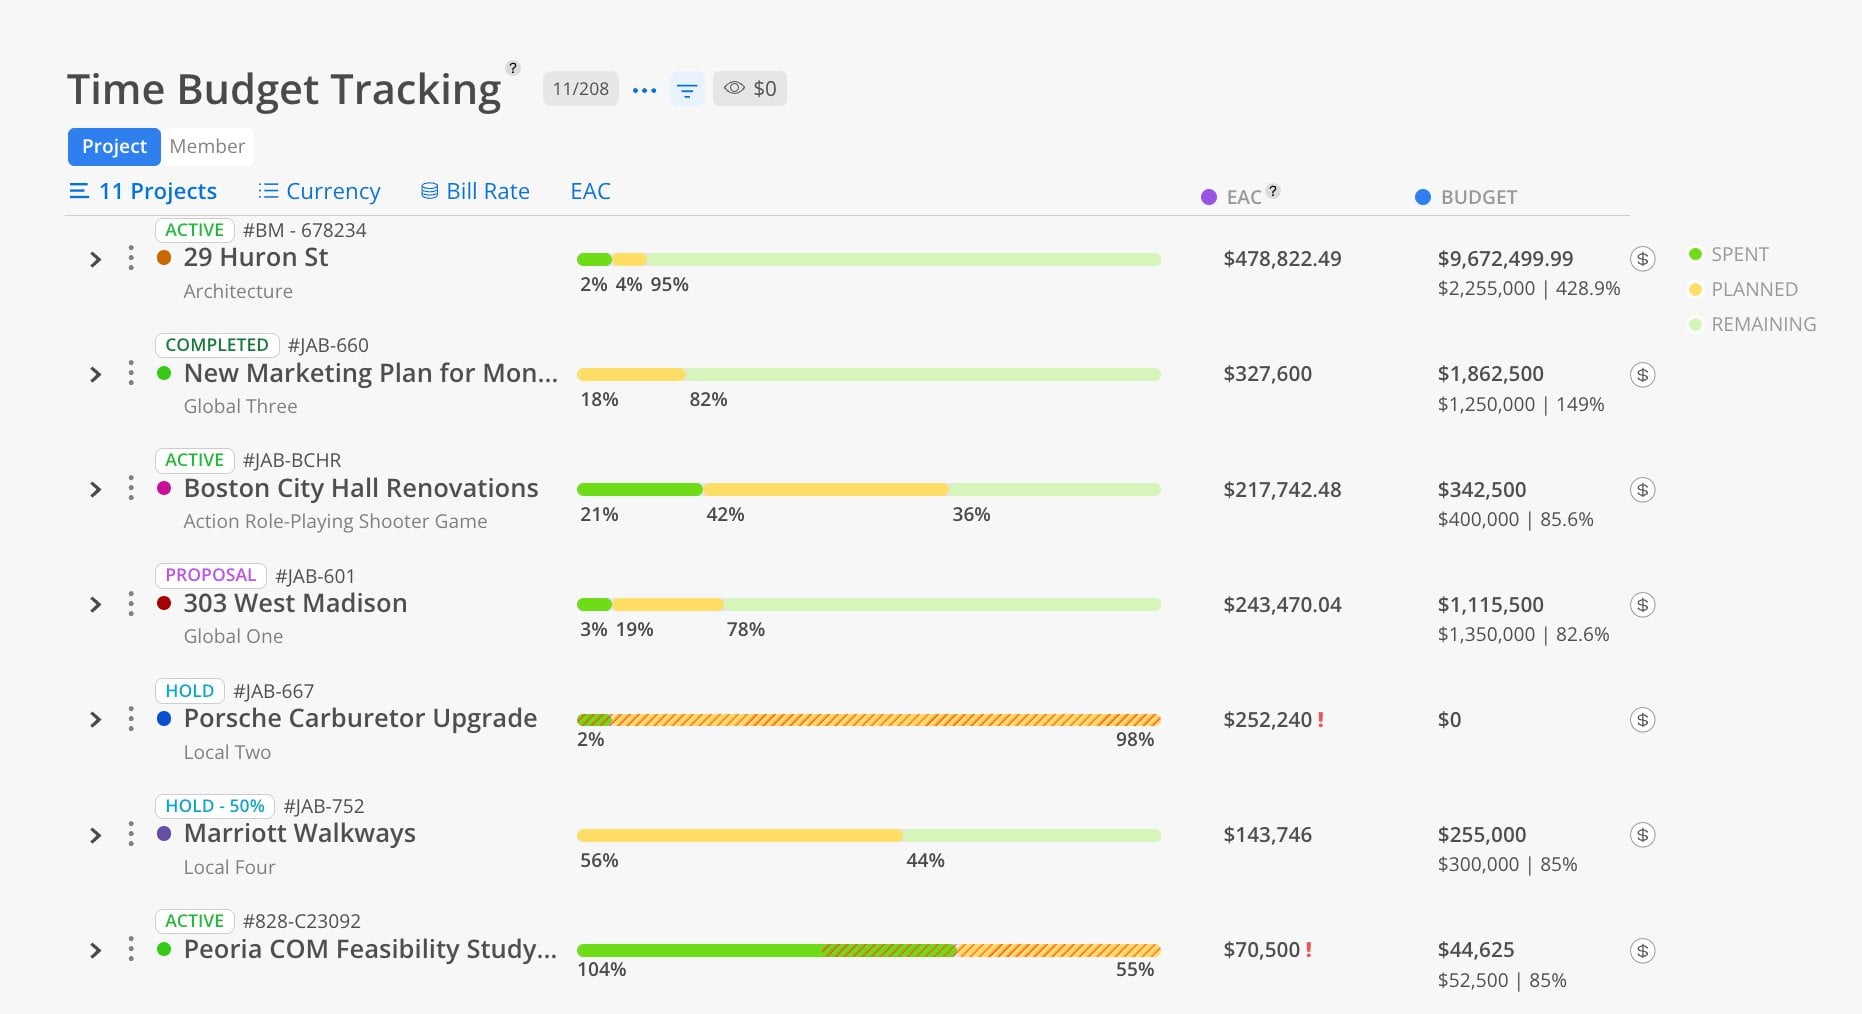
The Bars
Green = spent time
Yellow = planned time (from today forward)
Light green = remaining budget
Hashed yellow = tentative planned time
Columns & Indicators
EAC column = total Estimate at Completion (spent + planned) for each project or phase
Budget column = budget set for the project or phase, with fee and percentage used shown below
Red exclamation mark (!) = project or phase is projected to exceed its budget
Controls
EAC / Remaining toggle — switch between seeing total projected spend or what is left
Currency / Hours toggle — switch the unit of display
Eye icon — hide rows with zero values
Filter icon — narrow results by specific criteria
Three-dot menu — export options
Budget link ($) — jump to the Budget space for any project
The Budget column shows the total budget amount. Below it, you may see a second line showing the original fee and a percentage (e.g., $80,000 | 149.9%). This percentage indicates how much of the fee the EAC represents — anything over 100% means the project is projected to exceed its fee.
Rate — uses the standard billing rate for calculations
Bill — uses the bill rate assigned to the project or member
Cost — uses the cost rate (restricted to admins and budget managers, indicated by a lock icon)
This report has 2 views: Project, Member. Each view shows the same underlying data organized from a different starting point.
When in the Project tab, each project row displays:
Spent (green bar) — hours or dollars already logged from the past
Planned (yellow bar) — hours or dollars planned from today forward
Remaining (light green bar) — budget that has not yet been spent or planned
Percentage indicators — show the proportion of spent, planned, and remaining within the bar
Click the Project tab at the top.
Select projects by name, number, or portfolio.
Toggle between EAC and Remaining using the view dropdown.
Toggle between Currency and Hours.
Click the Bill Rate dropdown to choose between Rate, Bill, or Cost.
Expand a project to see each phase underneath. Each phase shows its own bar, EAC, and budget. Phases display their status (e.g., Not Started), phase dates, and dependency icons.

When in the Member tab, each member row displays:
Total spent and planned across all their projects
EAC and Budget totals for that member
Click the Member tab at the top.
Select members.
Toggle between EAC and Remaining.
Toggle between Currency and Hours.
Expand a member to see each project they are assigned to. Each project row under the member shows its status, project number, spent/planned bar, EAC, budget, and the budget link ($) icon. Red exclamation marks flag projects where the member's EAC exceeds the budget.
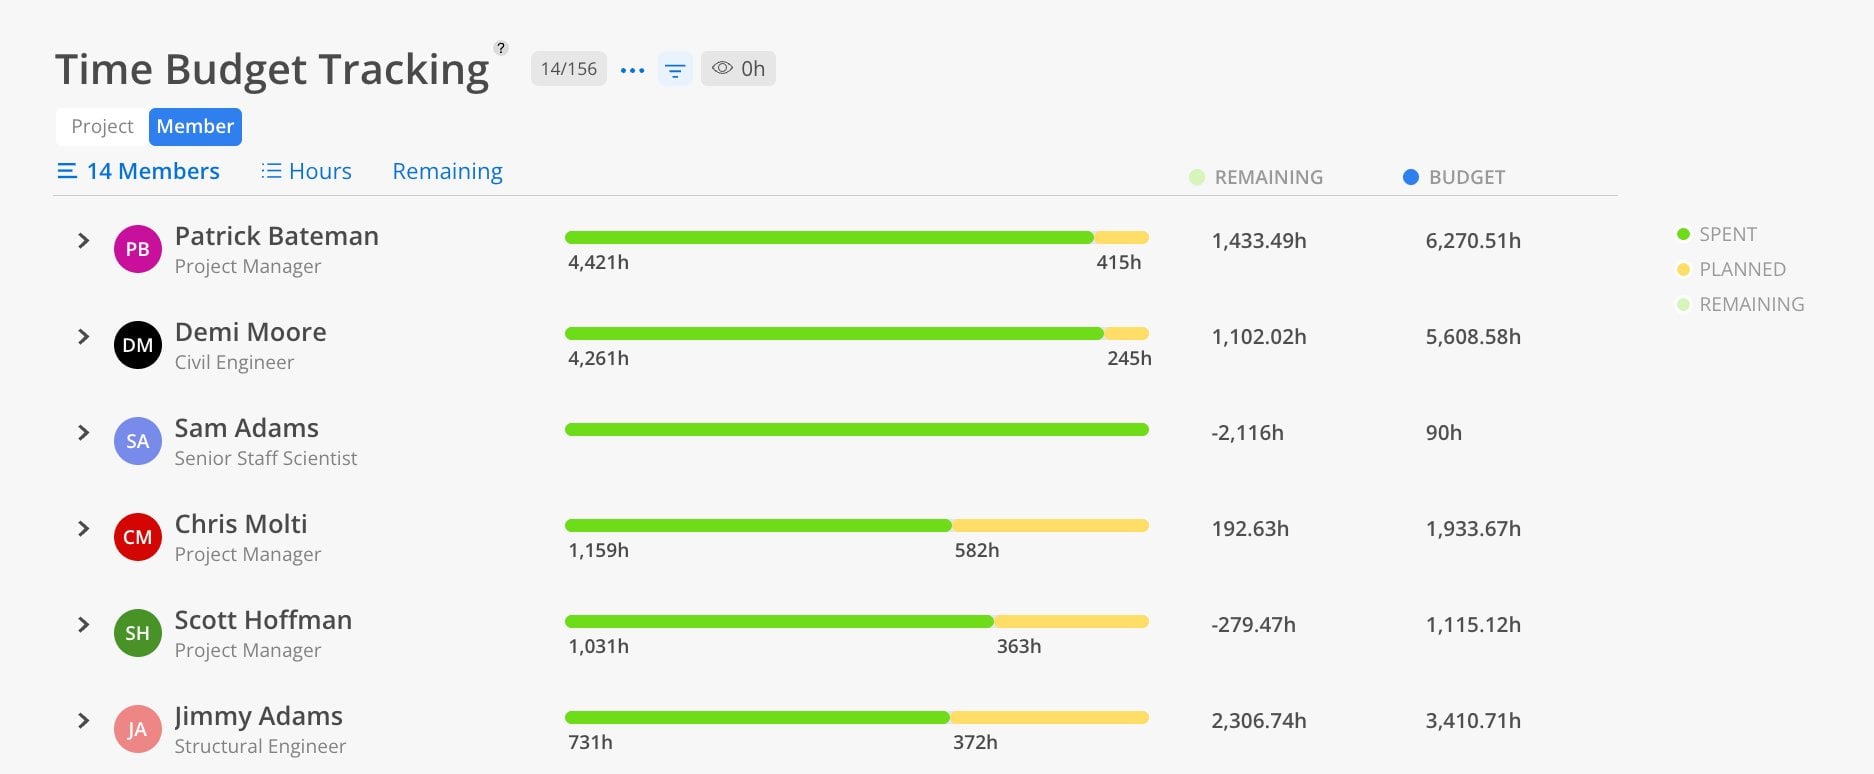
Use the Member tab for individual accountability — Quickly see which members are driving over-budget situations across their projects.
Check the percentage under Budget — When it exceeds 100%, that project's EAC is projected to exceed the fee.
Enter budgets for all projects — Projects without budgets entered will not show meaningful data in this report.