Every report in Mosaic shares a common set of controls for switching views, filtering data, changing units, and exporting. Not every control appears on every report — the available options depend on what data the report displays. This guide explains each control so you know what it does when you encounter it.
Most reports offer multiple perspectives on the same data. The view tabs appear at the top left of the report, directly below the report title.

Member — organizes data by team member. Each row is a person. Expand to see their projects and phases.
Project — organizes data by project. Each row is a project. Expand to see phases and then individual members.
Client — organizes data by client. Each row is a client. Expand to see their projects underneath.
Team — displays a chart view summarizing the data across all selected members. Typically shows a bar or area chart over time.
Not every report has all four tabs. Some reports have only Project and Member. The Timesheet Report has Date, Member, Project, and Activity. The active tab is highlighted in blue.
Below the view tabs, a selection bar shows what is currently loaded in the report.


Count indicator (e.g., "20 Members" or "9 Projects") — click to open the selector and choose which members or projects to include. This is also where you access filters to narrow by department, role, office, portfolio, etc.
Date range (e.g., "Apr 14 - May 13") — click to change the time period. Options vary by report and may include This Week, Next Week, 30 Days, 3 Months, Custom, At Completion, Today Backward, All Time, or specific months.
Currency / Hours toggle — switch between viewing data in dollar values or hours. Available on most reports that display financial data.
Bill Rate dropdown — choose how dollar values are calculated. Options include Rate (standard billing rate), Bill (project or member bill rate), and Cost (internal cost rate, restricted to admins and budget managers).
View mode (e.g., "At Completion", "Remaining", "Planned Time") — some reports let you toggle between different calculation modes. For example, the Time Budget Tracking report switches between EAC and Remaining views. The Budget Variance report switches between Spent vs. Project Fee, Project Budget, Planned Time, or Member Budget.
List toggle — on some reports, switches the display format.
TOTAL column header — click to sort by the total value.
The three blue dots (...) in the top area of the report open the export menu.
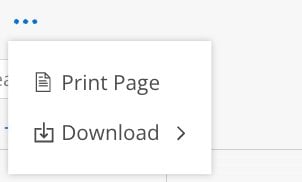
Print Page — generates a printable version of the current report view. Available on all reports.
Download — exports the report data as a CSV or other file format. Only available on certain reports (e.g., the Timesheet Report supports CSV download). If the Download option does not appear, that report only supports Print.
The filter icon (three horizontal lines, ≡) opens the advanced filter panel. Use it to narrow down the data beyond what the member or project selector provides.
Available filters depend on the report and your admin settings. Common filters include department, role, office, project status, project type, and portfolio. Filters stack — you can apply multiple at once.
Note: Filters are not dynamic. If a member is added to a department after you set a filter, you need to reapply the filter to see the change.
The eye icon with a dollar or hour value (e.g., ⊘ $0 or ⊘ 0h) toggles visibility of rows with zero values.

When enabled — rows with $0 or 0 hours are hidden. This cleans up your view when you only want to see projects or members with actual data.
When disabled — all rows are shown, including those with no data for the selected period.
This is especially useful in the Planned Time, Spent Time, and Timesheet reports where many projects may have no data for a given date range.
The dollar sign icon ($) appears on reports that display project-level financial data. Clicking it takes you directly to that project's Budget space.

This shortcut appears on the Estimate at Completion, Spent Time, Planned Time, Time Budget Tracking, Backlog, and variance reports. It saves you from navigating out of the report space to check or adjust a project's budget.
Many reports display a summary gauge or donut chart in the top right corner. This gives you an at-a-glance aggregate of the data currently loaded in the report.
Depending on the report, the gauge may show:
% of Hours or % of Capacity — how much of total capacity is planned (Workload Report)
Planned vs. Capacity — total planned hours and total capacity hours
Billable vs. Not Billable — utilization breakdown (Utilization Report)
Entered vs. Total — timesheet completion status (Timesheet Status Report)
Planned and Tentative totals — with checkboxes to toggle each on or off (Planned Time Report)
The legend next to the gauge explains each color and value. Some gauges have toggles (checkboxes or switches) that let you include or exclude specific data types from the calculation — such as time off, holidays, tentative plans, or open role plans.
On reports with horizontal bars (Workload, Utilization), a small color toggle icon lets you switch from single-color bars to multi-color bars that show project distribution.
Off — each row shows one solid-color bar
On — the bar splits into segments, one per project, using the project's assigned color
This is useful for quickly seeing whether a member's time is concentrated on one project or spread across many.
Reports use red visual indicators to flag issues:
Red asterisk (*) — member is over capacity (Workload Report)
Red exclamation mark (!) — project or member is over budget, or a time entry is outside phase dates
Red percentage — spent exceeded planned, or actual exceeded original estimate (Variance and Schedule reports)
Red dollar amount — negative value, meaning over budget or over fee (Budget Tracking, Backlog, Profit Margin)
Red bar — project is in the negative / losing money (Profit Margin)
When you see bars with diagonal hatch lines instead of solid fill:
Hashed yellow — tentative planned time (not yet confirmed)
Hashed yellow/green — open role planned time (assigned to a placeholder, not a real member)
These appear in the Workload, Backlog, and Role Demand reports. You can often toggle tentative and open role data on or off using checkboxes in the summary area.
Most report rows have an expand arrow (>) on the left. Clicking it drills down one level:
Member view: Member → Projects → Phases
Project view: Project → Phases → Members
Client view: Client → Projects → Phases
Role view: Role → Individual Members
Each level shows the same data broken down further. Click the arrow again to collapse the row.
Learn these controls once — they work the same way across every report. Once you know how to filter, toggle, and export in one report, you can navigate all 17.
Use the eye icon aggressively — hiding zero rows makes reports dramatically cleaner, especially during planning sessions.
The budget link ($) is a shortcut — instead of navigating to a project and opening its budget, click the $ icon directly from any report to jump straight there.
Export limitations — not every report supports CSV download. If you only see "Print Page" in the three-dot menu, that report does not support data export.