This report helps identify projects and phases that consistently run longer than expected. It requires phase start and end dates to be set on your projects. The report compares planned days against actual days and shows the result as a percentage of the original estimate.
Use the Schedule Variance Report when you need to answer: "Are our projects taking longer than we estimated — and by how much?" This report is ideal for improving future project templates and identifying estimation patterns. If schematic design consistently takes 253% of the original estimate, your templates need adjusting.
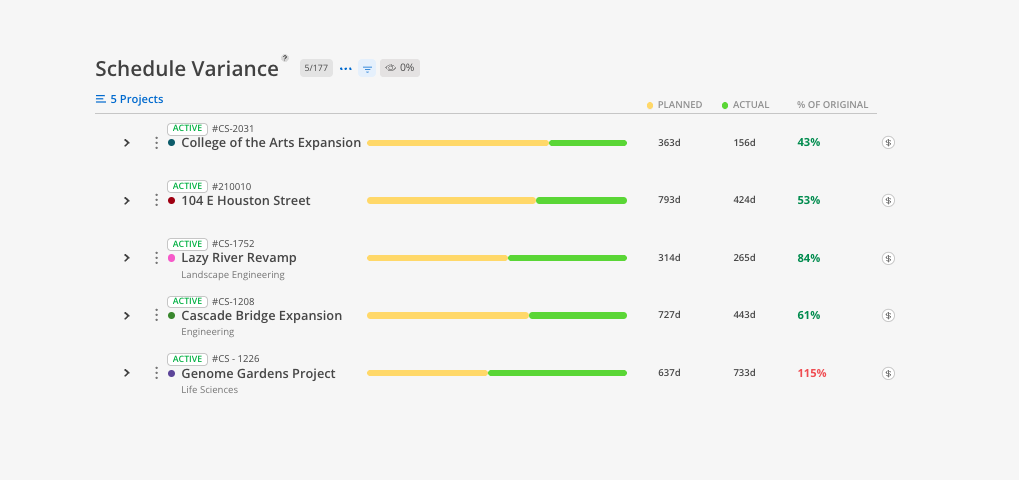
The Bars
Yellow = planned duration (days originally estimated)
Green = actual duration (days the project actually took or is taking)
Columns & Indicators
Planned column = exact number of planned days
Actual column = exact number of actual days
% of Original column = percentage of original estimate used. Red = ran over. Green = under or at estimate.
Controls
Eye icon — hide rows with zero values
Filter icon — narrow results by specific criteria
Budget link ($) — jump to the Budget space for any project
This report is organized by project.
Click Reports > Schedule Variance.
Select projects.
Review each project's planned days vs. actual days.
Look for red percentages — these indicate projects that exceeded their original schedule.
Expand a project to see each phase with its own planned vs. actual breakdown. This is where the real patterns emerge — you may find that certain phase types (e.g., design development) consistently run over while others stay on track.
Set phase dates from the start — This report only works when projects have accurate phase start and end dates entered.
Look for patterns across multiple projects — A single project being off schedule could be an anomaly. Multiple projects running over on the same phase type indicates a systemic estimation issue.
Red percentages over 100% mean the project ran longer than planned — For example, 253% means the project took 2.5x longer than the original estimate.
Green percentages under 100% mean the project finished early — For example, 38% means the project only used 38% of the planned time.