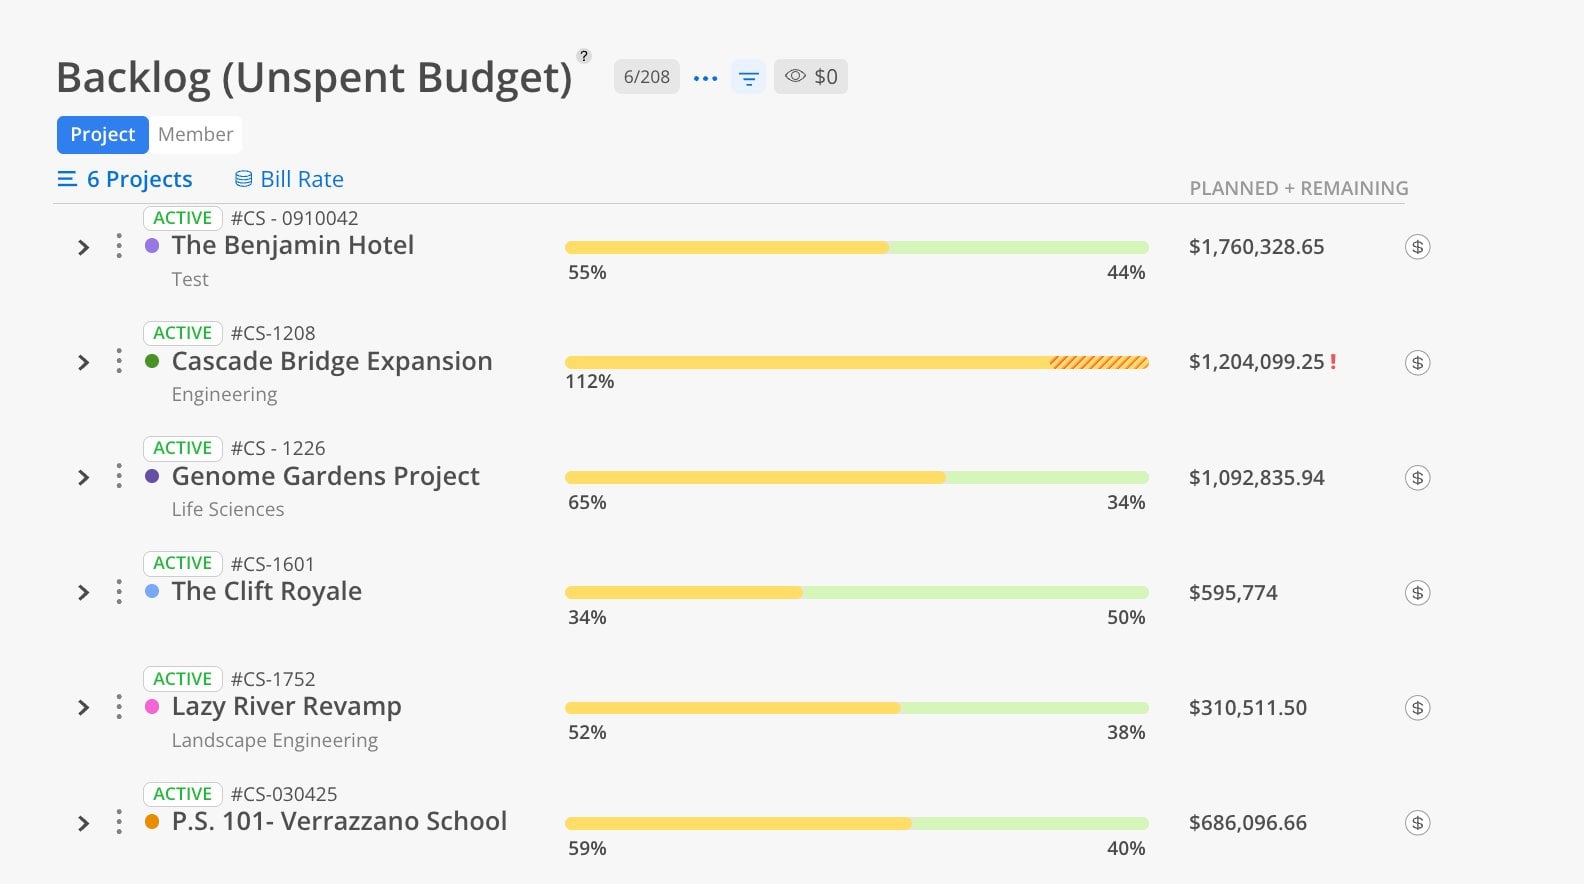
The Backlog report (formally titled "Backlog (Unspent Budget)") displays the combination of planned time and remaining budget for your projects. It flags projects that are over-committed with a red exclamation mark. Tentative and open role plans appear as hashed bars to distinguish them from confirmed plans.
Use the Backlog Report when you need to answer: "If we follow through on everything we have planned, will we stay within budget — and how much budget is left?" This is a forward-looking budget check. Unlike the Estimate at Completion Report which includes past spend, the Backlog Report focuses only on what is still ahead. Use it during planning sessions to validate that new work plans will not push a project over its budget.
The Bars
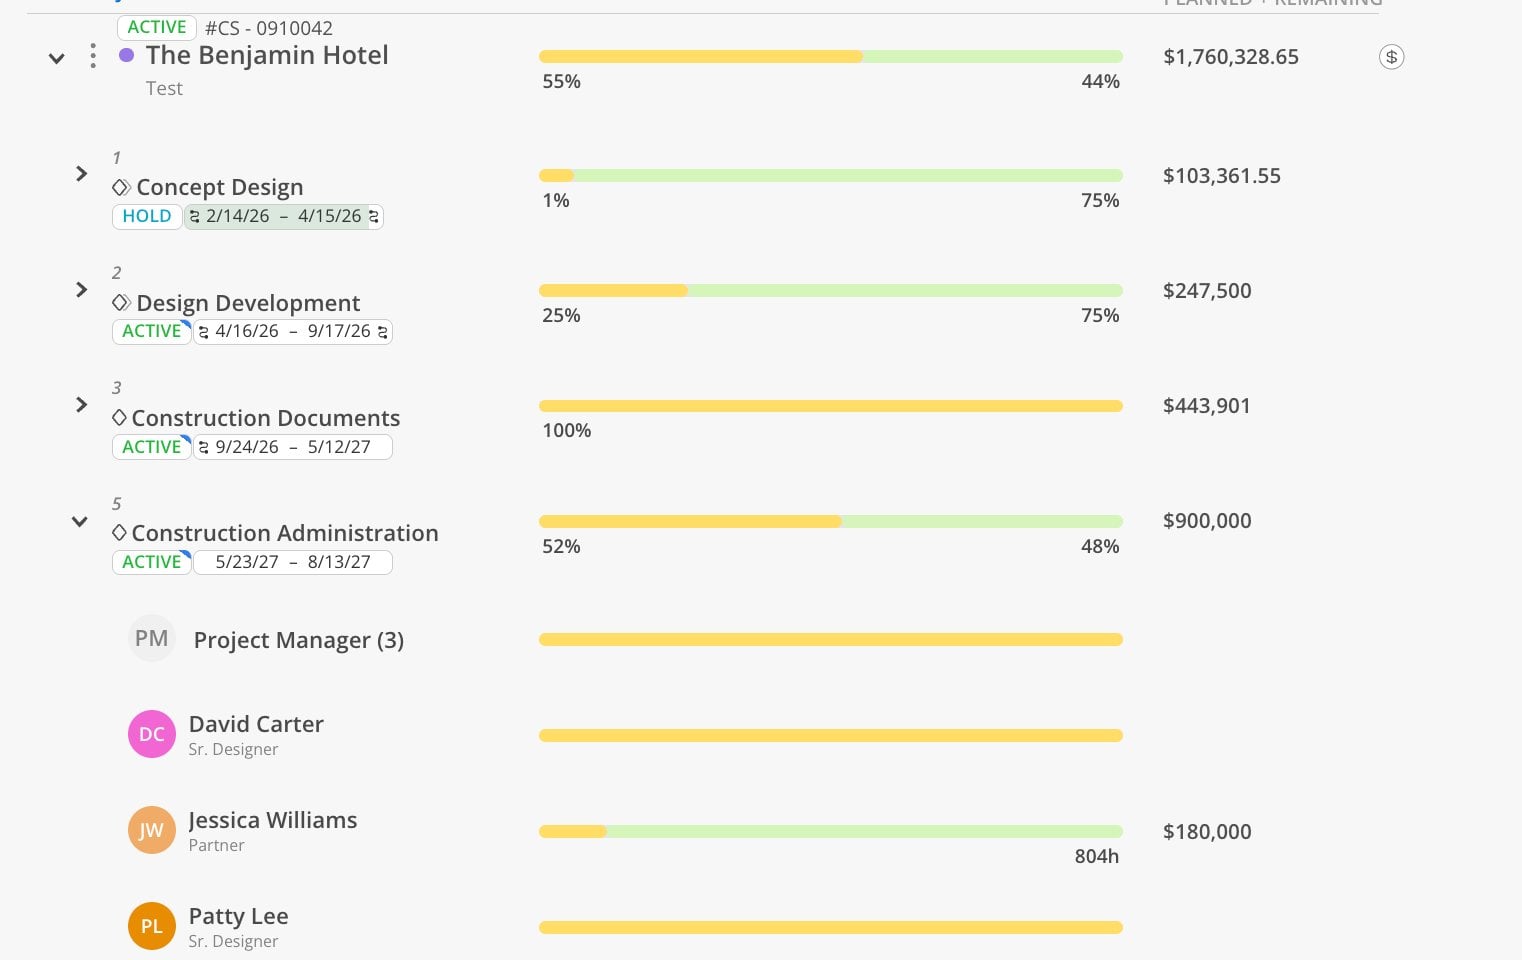
Solid yellow = confirmed planned time as a percentage of budget
Light green = remaining budget that is not yet planned
Hashed yellow = tentative or open role planned time
Percentage labels show the split between planned and remaining
Columns & Indicators
PLANNED + REMAINING column = total dollar value of planned time plus remaining budget
Red exclamation mark (!) = project is projected to exceed its budget (planned exceeds 100%)
Controls
Bill Rate dropdown — choose Rate, Bill, or Cost
Eye icon — hide rows with zero values
Budget link ($) — jump to the Budget space for any project
This report has 2 views: Project, Member. Each view shows the same underlying data organized from a different starting point.
The Project view shows unspent budget starting from the project level.
Click the Project tab at the top.
Select projects using the project selector.
Review the planned vs. remaining bars for each project.
Look for red exclamation marks indicating over-budget projections.
Look for bars exceeding 100% — these projects have more planned than budgeted.
Expand a project to see each phase's planned time and remaining budget. Hashed portions of the bar indicate tentative or open role plans that may or may not be confirmed. Within a phase, members are grouped by role (e.g., "Project Manager (3)") with individual allocations visible.
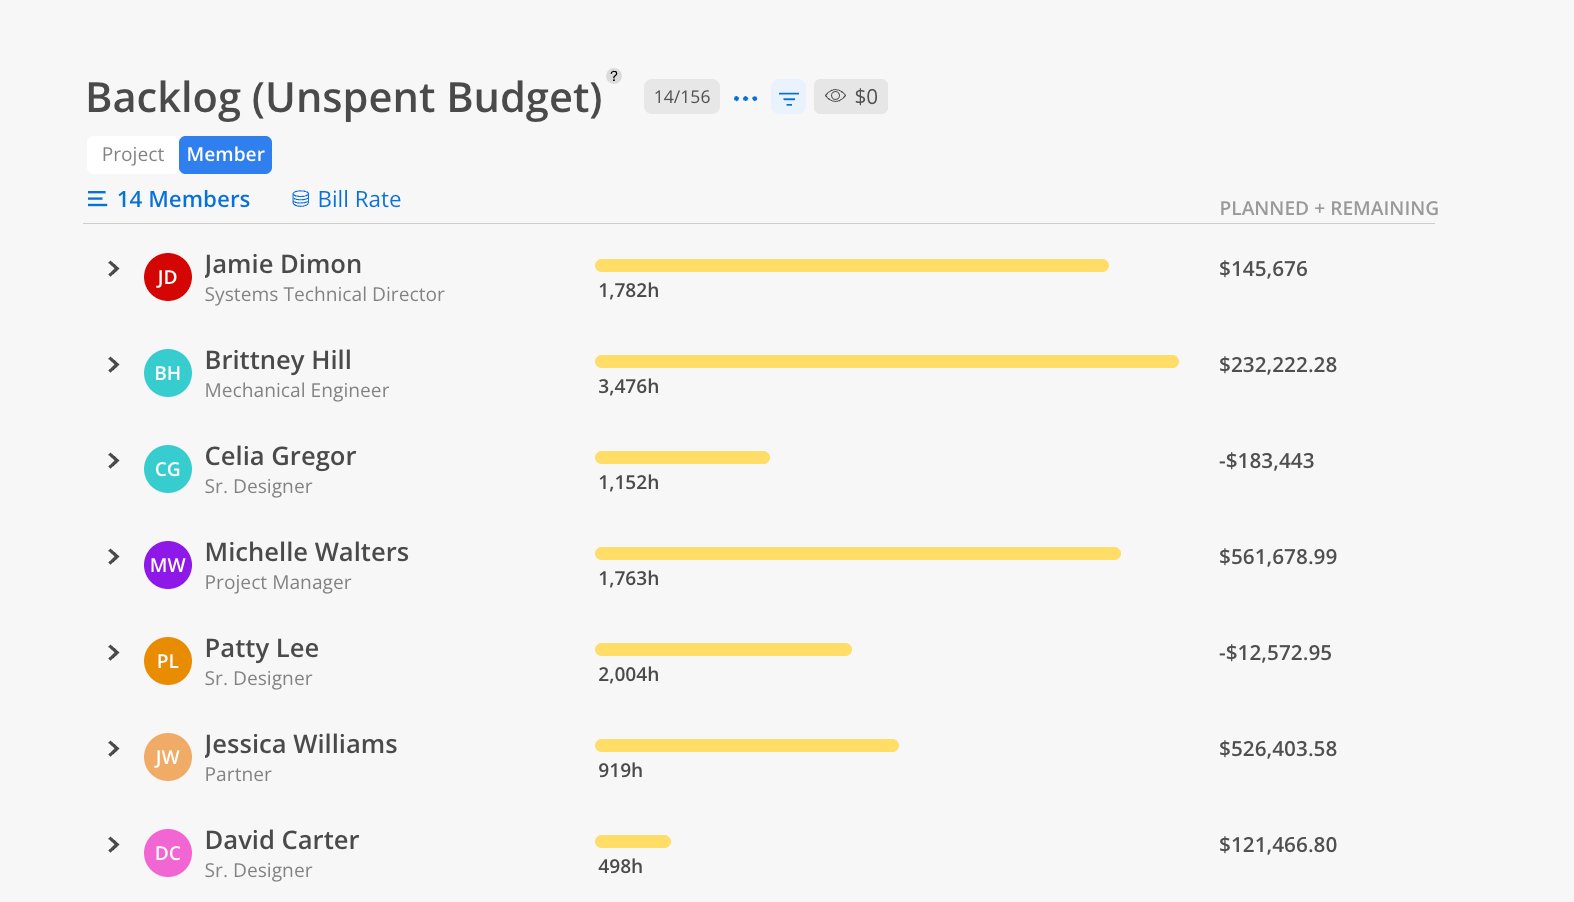
The Member view shows total planned backlog per team member across all their projects.
Click the Member tab at the top.
Select members.
Review total planned hours and the PLANNED + REMAINING dollar amount for each member.
Each member row shows their total planned hours as a bar with the dollar value on the right. Negative dollar amounts indicate the member's planned work across their projects exceeds the available budget. Expand a member to see which projects and phases their future planned time is allocated to.
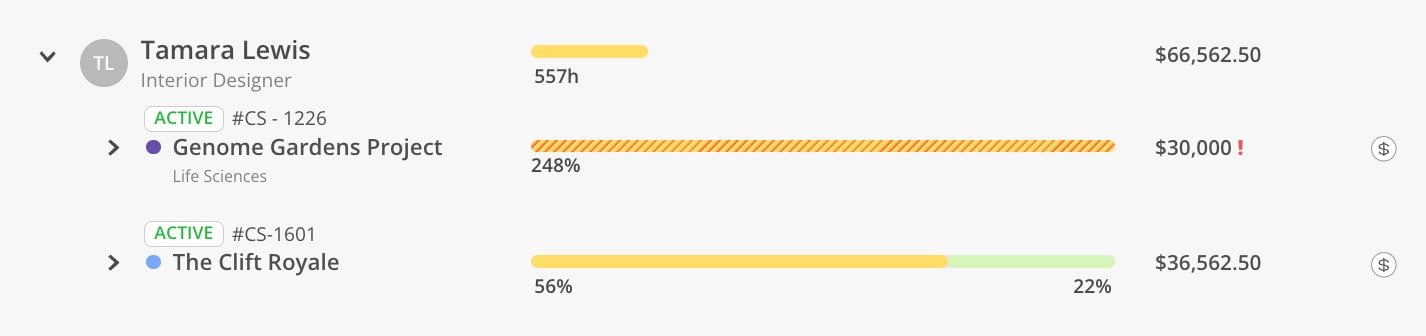
Hashed bars = tentative — Diagonal hatch lines indicate tentative or open role plans. These may change, so factor that into your planning.
Compare with Estimate at Completion — The Backlog Report focuses on future plans only. The Estimate at Completion Report adds historical spent time into the picture.
Negative amounts in Member view need attention — If a member shows a negative dollar value, their planned work exceeds available budget across their assigned projects.