The Budget Variance Report is the most flexible comparison report. It lets you choose what to compare spent time against using a "Spent vs." dropdown. In the Project view, you can compare against four different benchmarks: Project Fee, Project Budget, Planned Time, or Member Budget. In the Member view, you can compare against Planned Time or Member Budget. You can also toggle between Currency and Hours.
Use the Budget Variance Report when you need to answer: "How does our actual spend compare to our fee, our budget, our plans, or our member-level budgets?" This is the most versatile variance report. Use it for financial reviews with leadership (compare against fee), internal budget reviews (compare against budget), or operational accuracy checks (compare against planned time). The "Spent vs." dropdown lets you answer multiple questions from one report.
The Bars
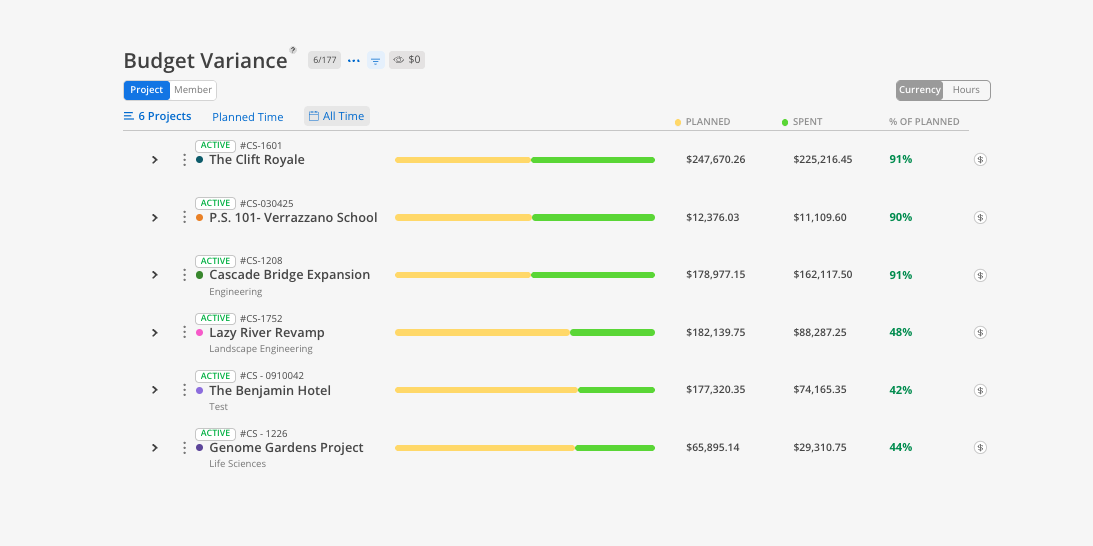
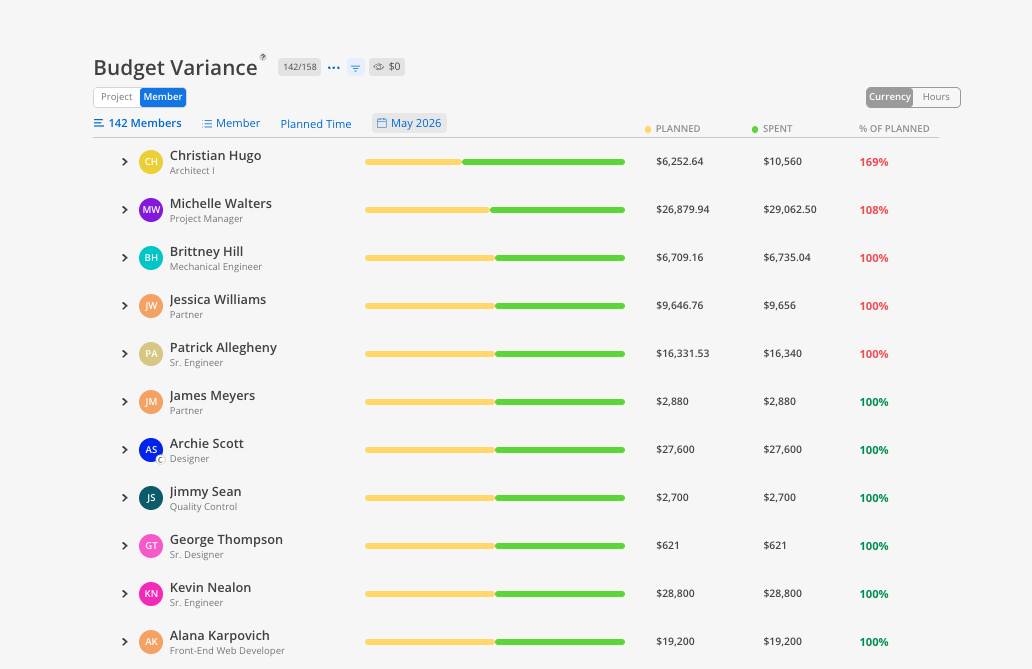
Yellow/green bars (in Planned Time mode) = planned vs. spent
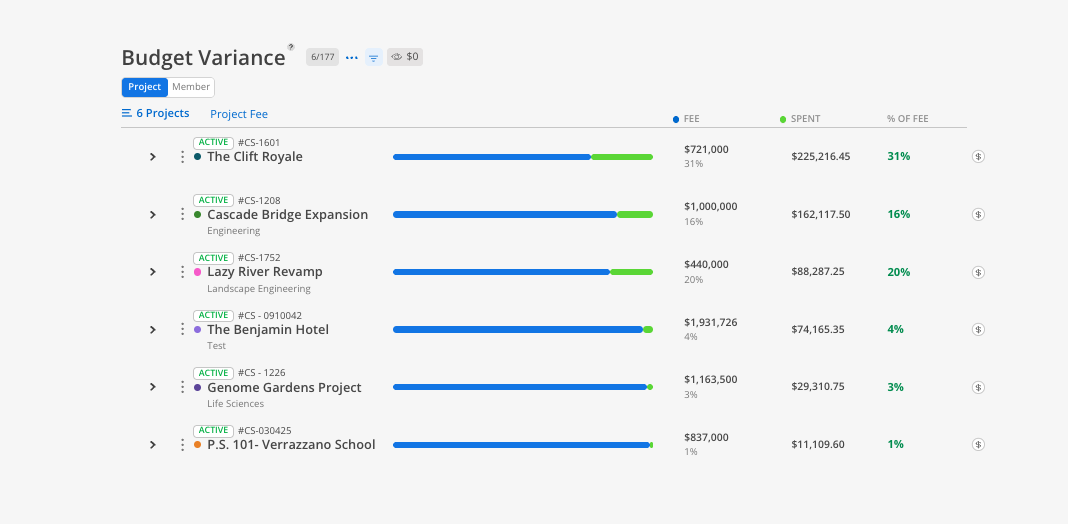
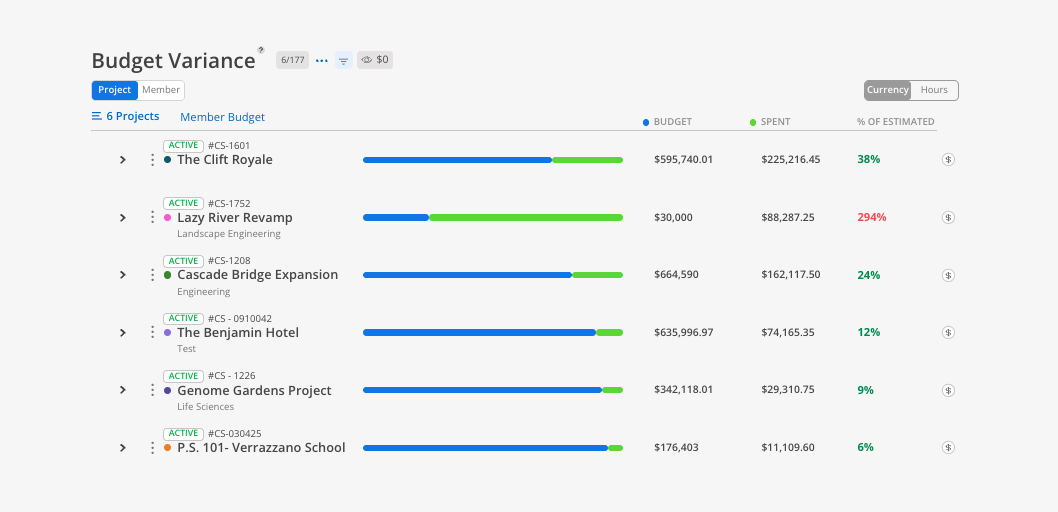
Blue/green bars (in Fee or Budget mode) = fee or budget vs. spent
Columns & Indicators
Benchmark column = the value you are comparing against (Fee, Budget, Planned, or Member Budget)
Spent column = actual dollars or hours logged
% column = percentage of benchmark spent. Red = over. Green = under.
Controls
"Spent vs." dropdown — choose what to compare against (Project Fee, Project Budget, Planned Time, or Member Budget)
Currency / Hours toggle — switch the unit of display
Date range selector — filter to a specific period
Budget link ($) — jump to the Budget space for any project
This report has 2 views: Project, Member. Each view shows the same underlying data organized from a different starting point.
The Project view offers four comparison modes via the "Spent vs." dropdown:
Compare what you planned to spend against what was actually spent.
Click the Project tab.
Click the "Spent vs." dropdown and select Planned Time.
Select projects and a date range.
Review Planned, Spent, and % of Planned columns.
Compare actual spend against the project fee to see what percentage of the fee has been consumed.
Click the "Spent vs." dropdown and select Project Fee.
Review Fee (blue bar), Spent (green bar), and % of Fee columns.
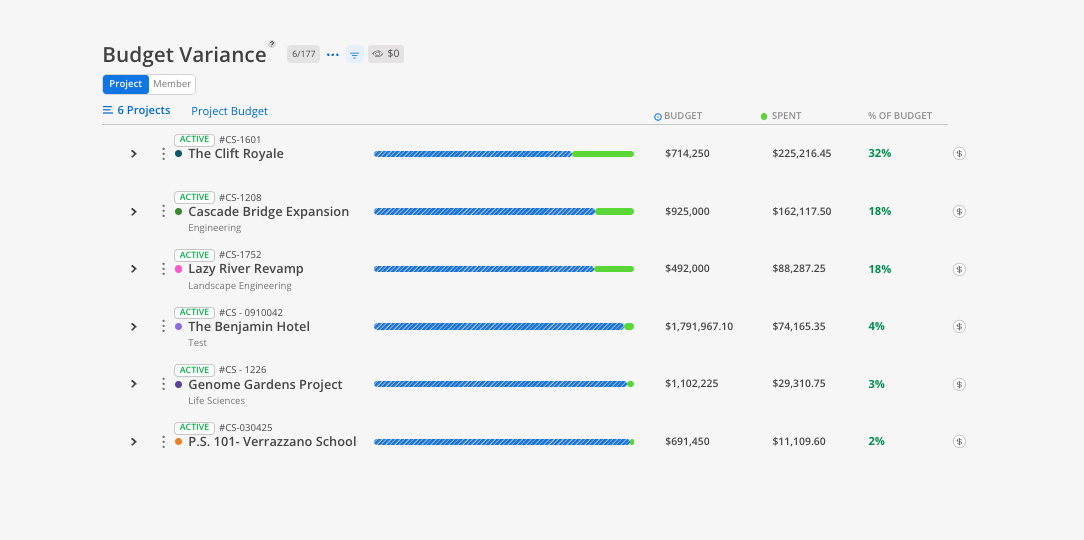
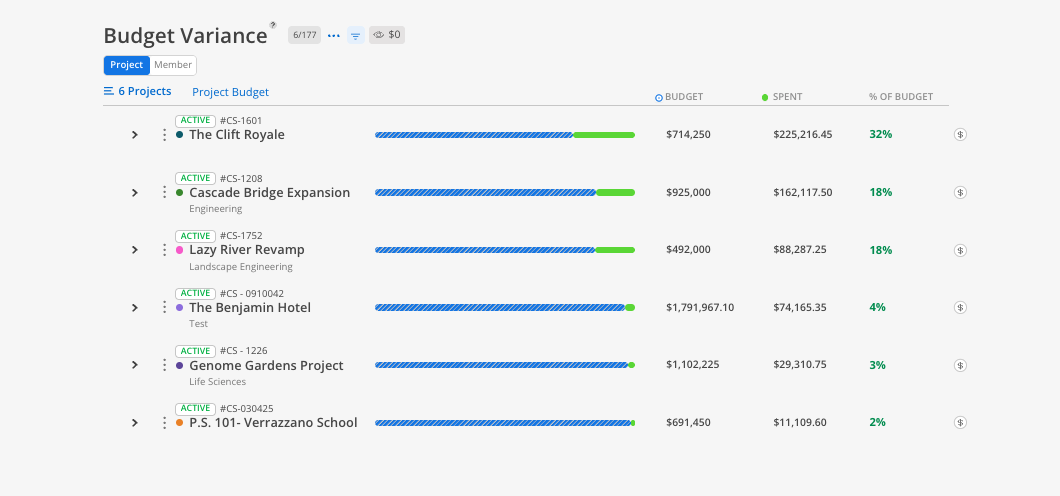
Compare actual spend against the internal project budget.
Click the "Spent vs." dropdown and select Project Budget.
Review Budget, Spent, and % of Budget columns.
Compare actual spend against member-level budgets set within each project.
Click the "Spent vs." dropdown and select Member Budget.
Review Member Budget, Spent, and % of Member Budget columns.
The Member view offers two comparison modes:
Click the Member tab.
Click the "Spent vs." dropdown and select Planned Time.
Select members and a date range.
Review each member's Planned, Spent, and % of Planned in dollars.
Click the "Spent vs." dropdown and select Member Budget.
Review each member's Member Budget, Spent, and % of Member Budget.
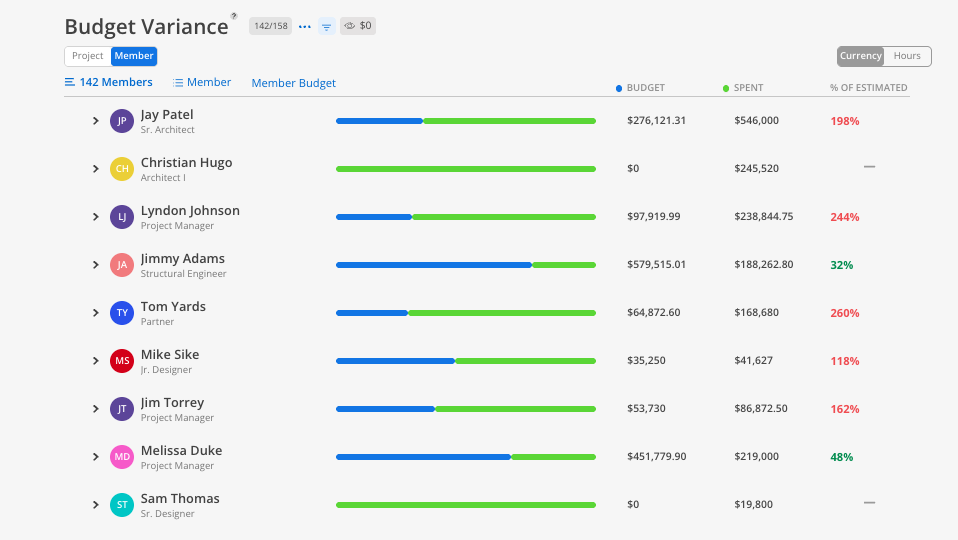
Expand any member to see which projects and phases are driving their variance.
Project view has more comparison options than Member view — Project view offers four "Spent vs." modes. Member view offers two.
Use Project Fee for revenue tracking — Compare against the fee when you need to know if the project is staying within the contracted amount.
Use Project Budget for internal cost tracking — Compare against the budget when you need to know if the project is within your internal cost estimate.
Use Planned Time for operational accuracy — Compare against planned time to see if your team's estimates were accurate.
Toggle to Hours for time-based analysis — Currency is the default, but switching to hours can be useful for operational reviews.