This report displays all logged spent time. Anywhere you see green in Mosaic, that represents spent time data. This report shares the same view structure as other reports with expandable drill-down.
Use the Spent Time Report when you need to answer: "Where has our time actually been going?" This is the backward-looking companion to the Planned Time Report. Use it to review how hours or dollars were spent across projects and members for any past period — last week, last month, or all time. Ideal for end-of-month reviews or comparing actual spend against what was planned.
The Bars
Green = hours or dollars of time already logged
Controls
Currency / Hours toggle — switch between dollars and hours
Date range selector — last month, all time, or custom
Eye icon — hide rows with zero values
Budget link ($) — jump to the Budget space for any project
This report has 2 views: Project, Member. Each view shows the same underlying data organized from a different starting point.
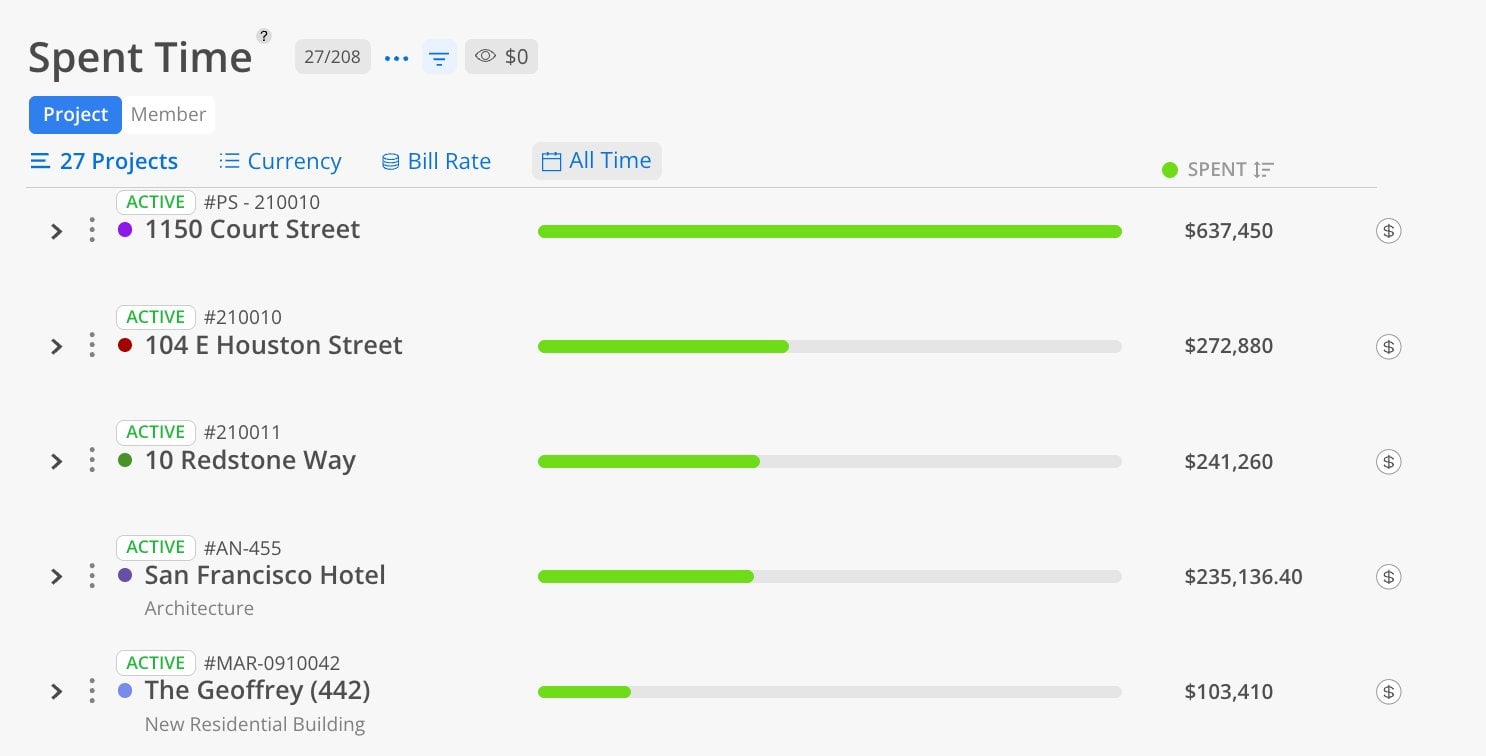
The Project view shows total spent time starting from the project level.
Click the Project tab at the top.
Select projects by name, number, or portfolio.
Choose a date range.
Toggle between hours and currency.
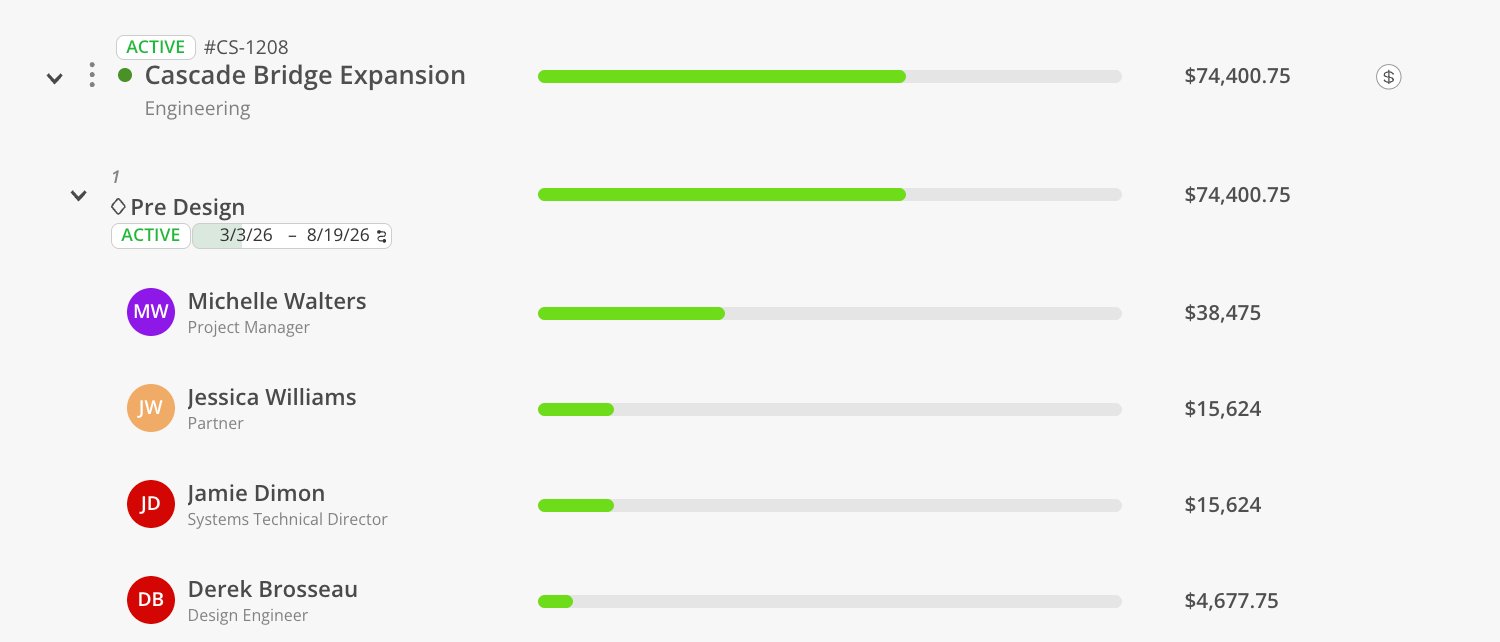
Each project shows total spent hours or dollars. Expand to see the phase breakdown, and expand further to see individual member spend within each phase.
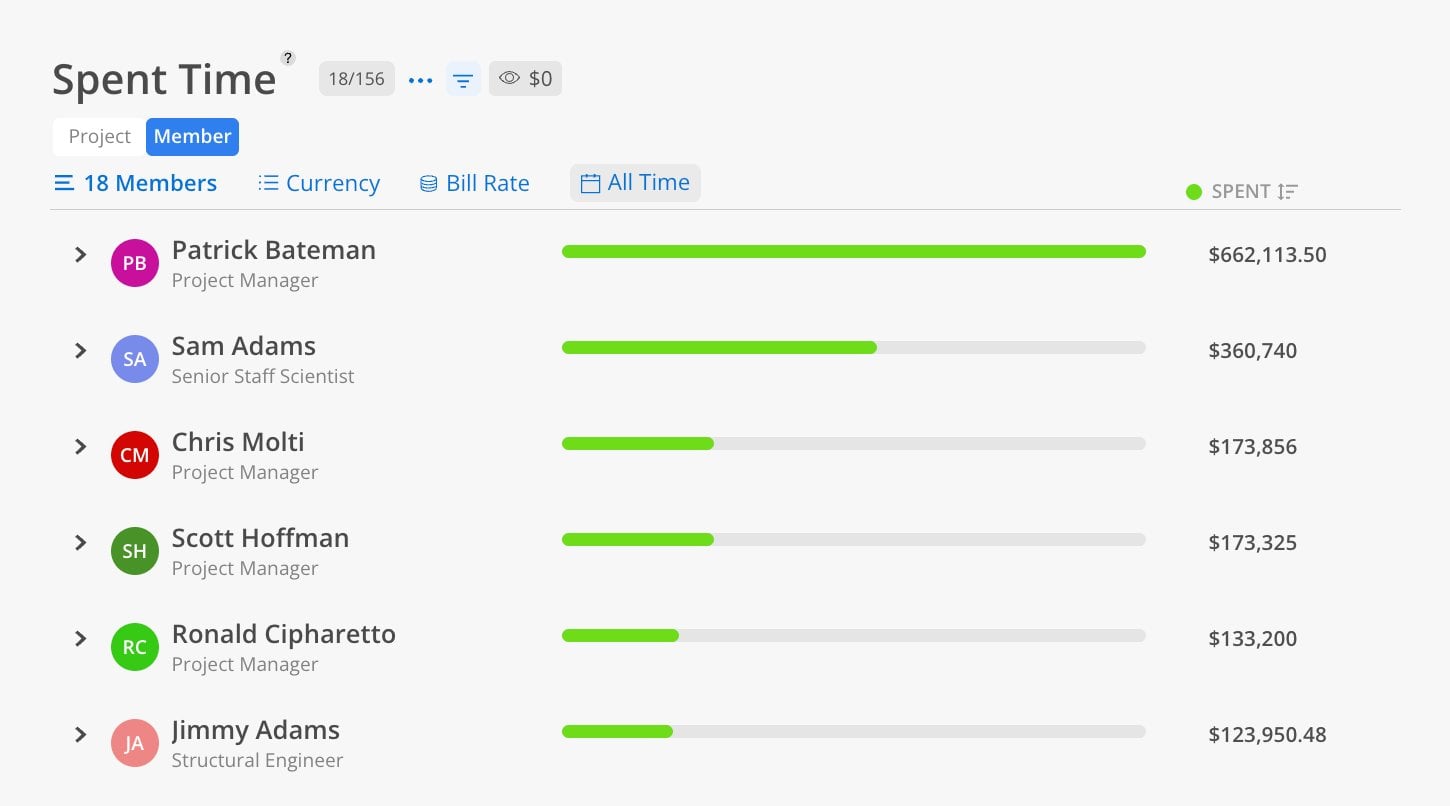
The Member view shows total spent time starting from the member level.
Click the Member tab at the top.
Select members.
Choose a date range.
Toggle between hours and currency.
Each member row shows total spent hours or dollars across all their projects. Expand to see which projects and phases their time was logged against. This is the inverse of the project view — same data, different starting point.
Use project view with the eye icon — When reviewing a specific period, toggle the eye icon to only show projects that had activity in that timeframe.
Compare with Planned Time — Use the Spent Time Report alongside the Planned Time Report to see whether historical spend aligns with future plans.