Unlike the Workload Report which shows plans relative to capacity, this report focuses on the financial and time impact of planned work. It automatically shows today moving forward. Access it from the Reports tab under Planned Time.
Use the Planned Time Report when you need to answer: "How much work is planned for the future, and what does that look like in hours or dollars?" This report is ideal for understanding the financial impact of upcoming plans, spotting members with no future work assigned, or reviewing how planned work is distributed across projects and phases.
The Bars
Solid yellow = confirmed planned time
Hashed yellow = tentative planned time
Gray = remaining capacity (unfilled portion)
Summary & Toggles (top right)
Summary gauge — total planned dollars or hours as a visual ring
Planned checkbox — toggle confirmed plans on or off, with amount and percentage (e.g., 71% Planned)
Tentative checkbox — toggle tentative plans on or off (e.g., 29% Tentative)
Total — combined planned + tentative amount
Controls
Currency / Hours toggle — switch between dollars and hours
Bill Rate dropdown — choose Rate, Bill, or Cost
Date range selector — this month, 30 days, all time, or custom
Eye icon — hide rows with zero planned time
Budget link ($) — jump to the Budget space for any project
This report has 2 views: Member, Project. Each view shows the same underlying data organized from a different starting point.
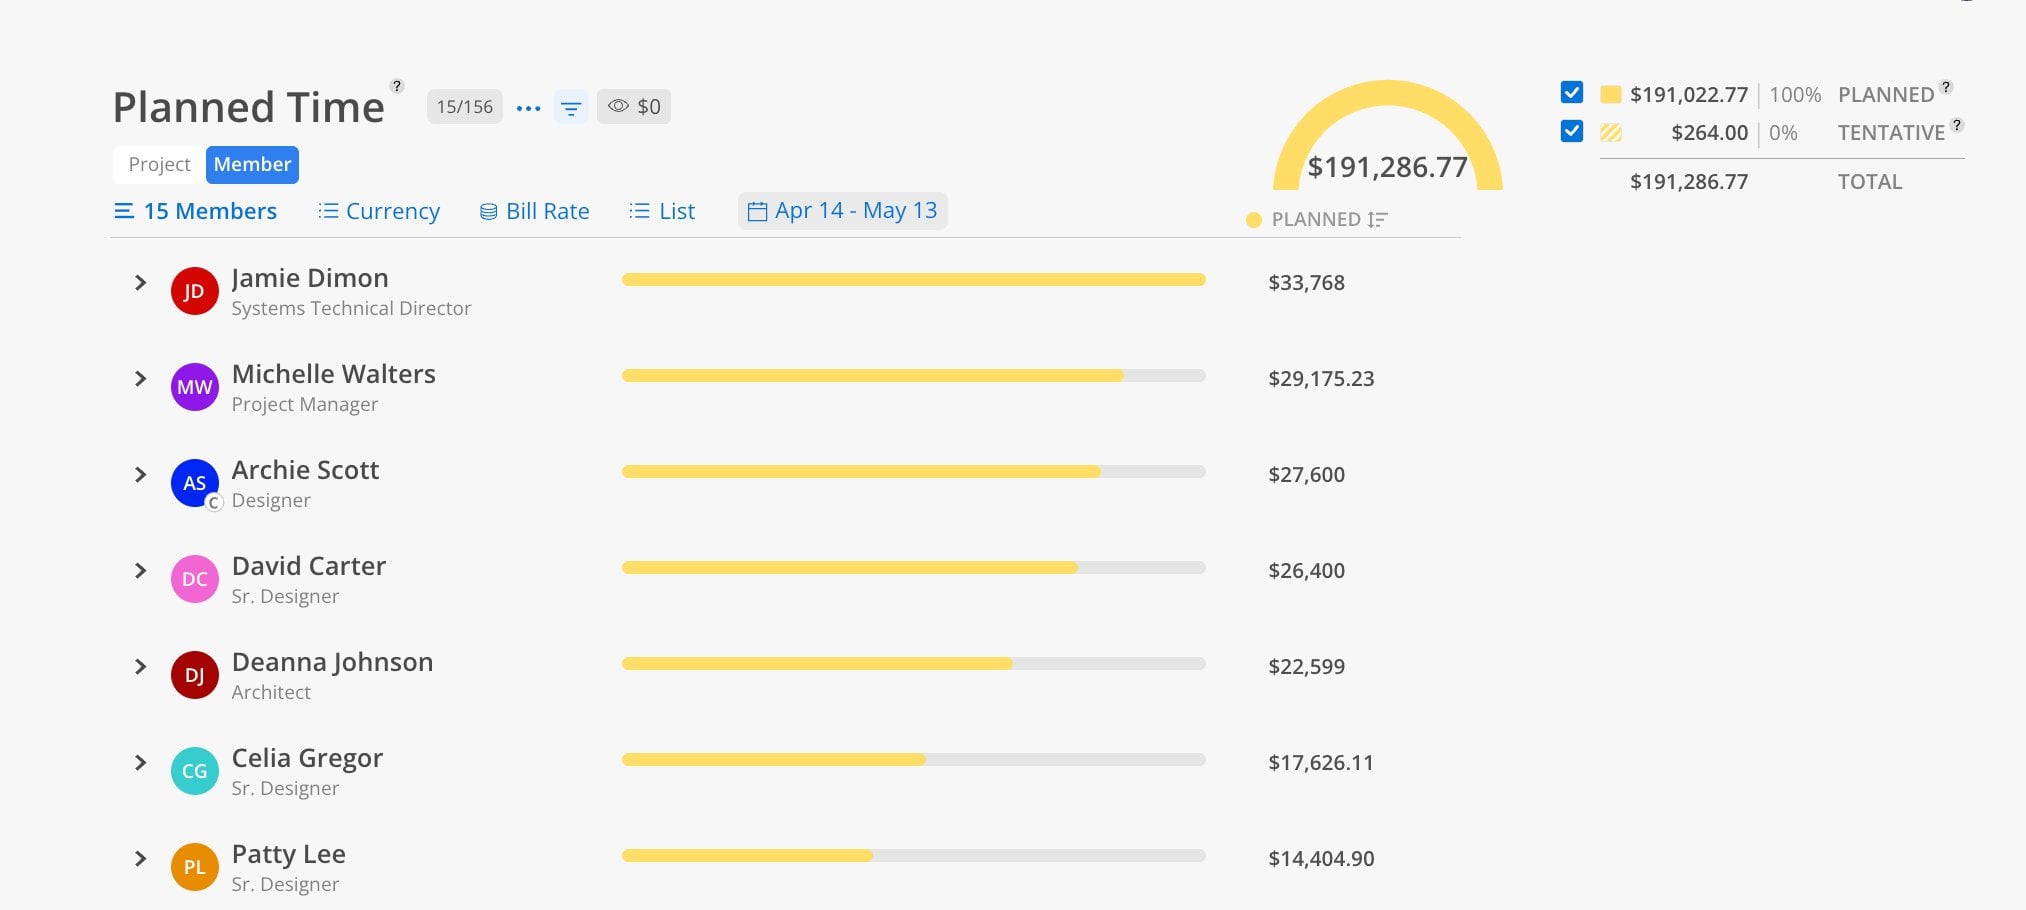
The Member view shows total planned time per person from today forward.
Click the Member tab at the top.
Select members using the member selector or filters.
Choose a date range.
Toggle between hours and currency.
Each member row shows their total planned hours or dollars. Expand a member to see which projects they are planned on, and expand further to see the specific phases. Use the eye icon to hide members with zero planned time.
Members showing zero planned time may need to be staffed on upcoming projects or may have their capacity adjusted.
Expand a member to see which projects and phases their planned time is allocated to, with dollar amounts at each level.

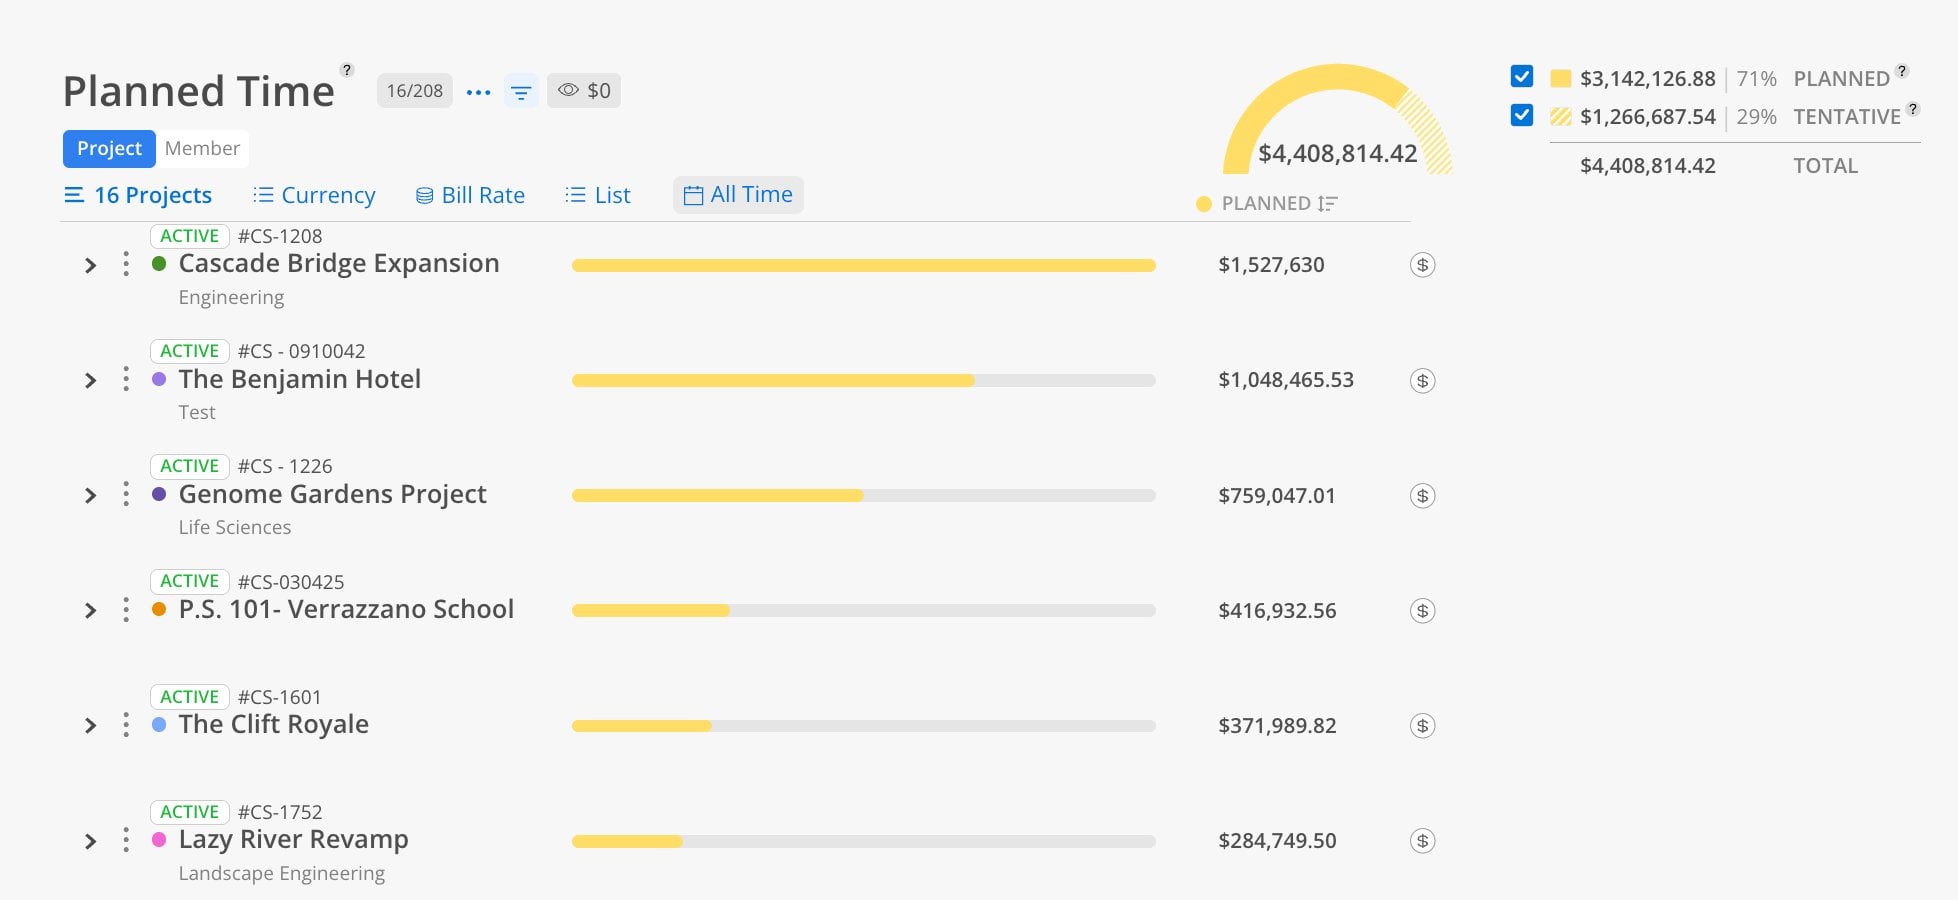
The Project view shows total planned time per project from today forward.
Click the Project tab at the top.
Select projects by name, number, or portfolio.
Choose a date range.
Toggle between hours and currency.
Each project row shows total planned hours or dollars. Expand to see the phase breakdown, and expand further to see individual member allocations within each phase.