Mosaic provides real-time visibility into project financials, enabling efficient tracking and management of project fees and team member time costs. By simplifying complex spreadsheet functions into intuitive, interconnected features, Mosaic enhances financial oversight. Tools like Budgets, Planner, and Reports offer clear insights into the financial health of projects and the organization.
Fees, Work Plan hours, and Timesheets are all integrated and updated in real time. Additionally, they can be connected to financial software to ensure an accurate and up-to-date budget.
Learn more about our Financial Integrations
In Mosaic's Budgets, project fees can be managed efficiently. Instead of discovering budget overruns after billing, Work Plans provide advanced insights, allowing for proactive adjustments, capturing additional services, and obtaining approvals before time is spent.
Mosaic definition of Project Budget and Phase Budget
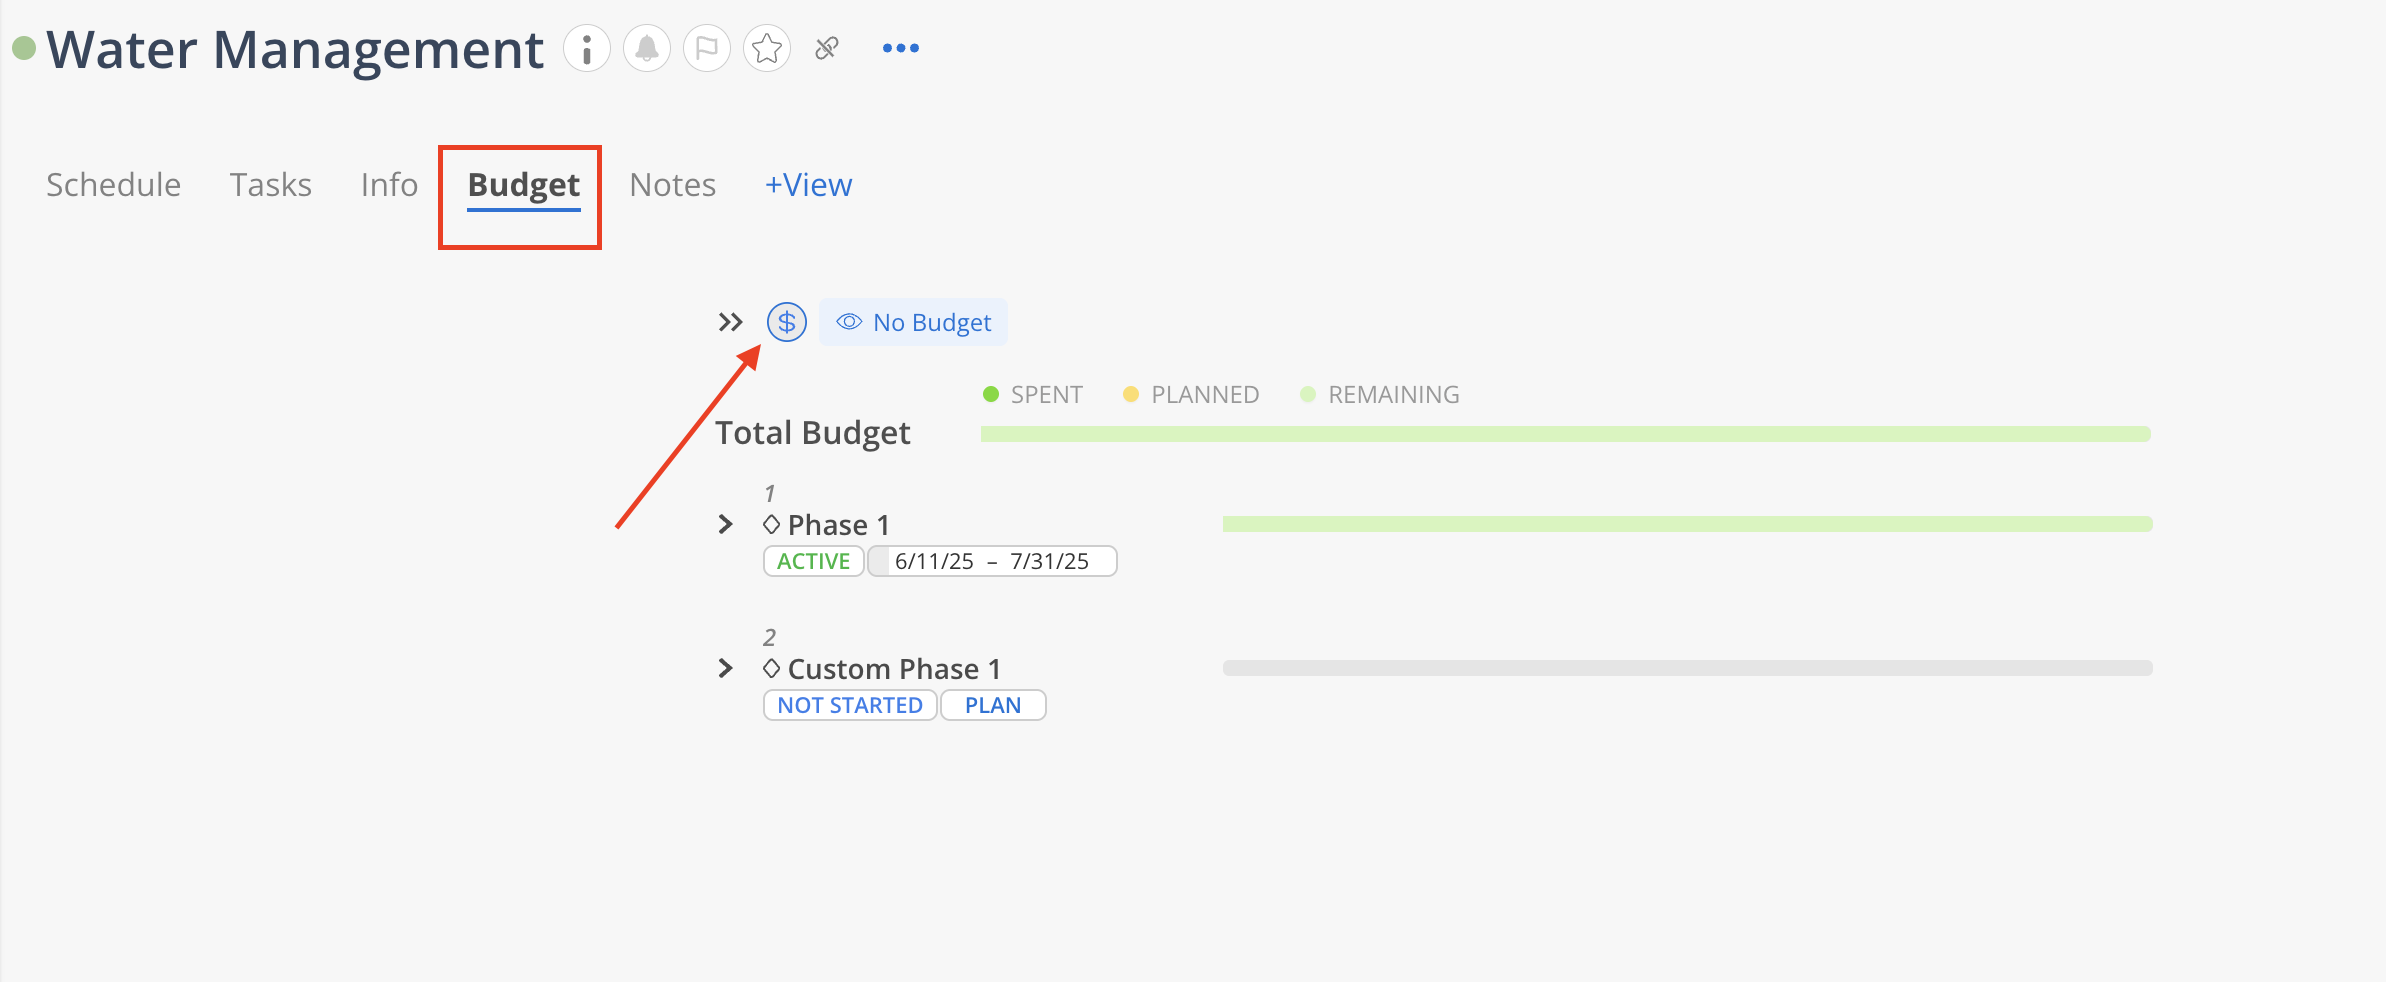
Any where you see the Budget icon button, allows you to open this modal, below is an example on Project space.

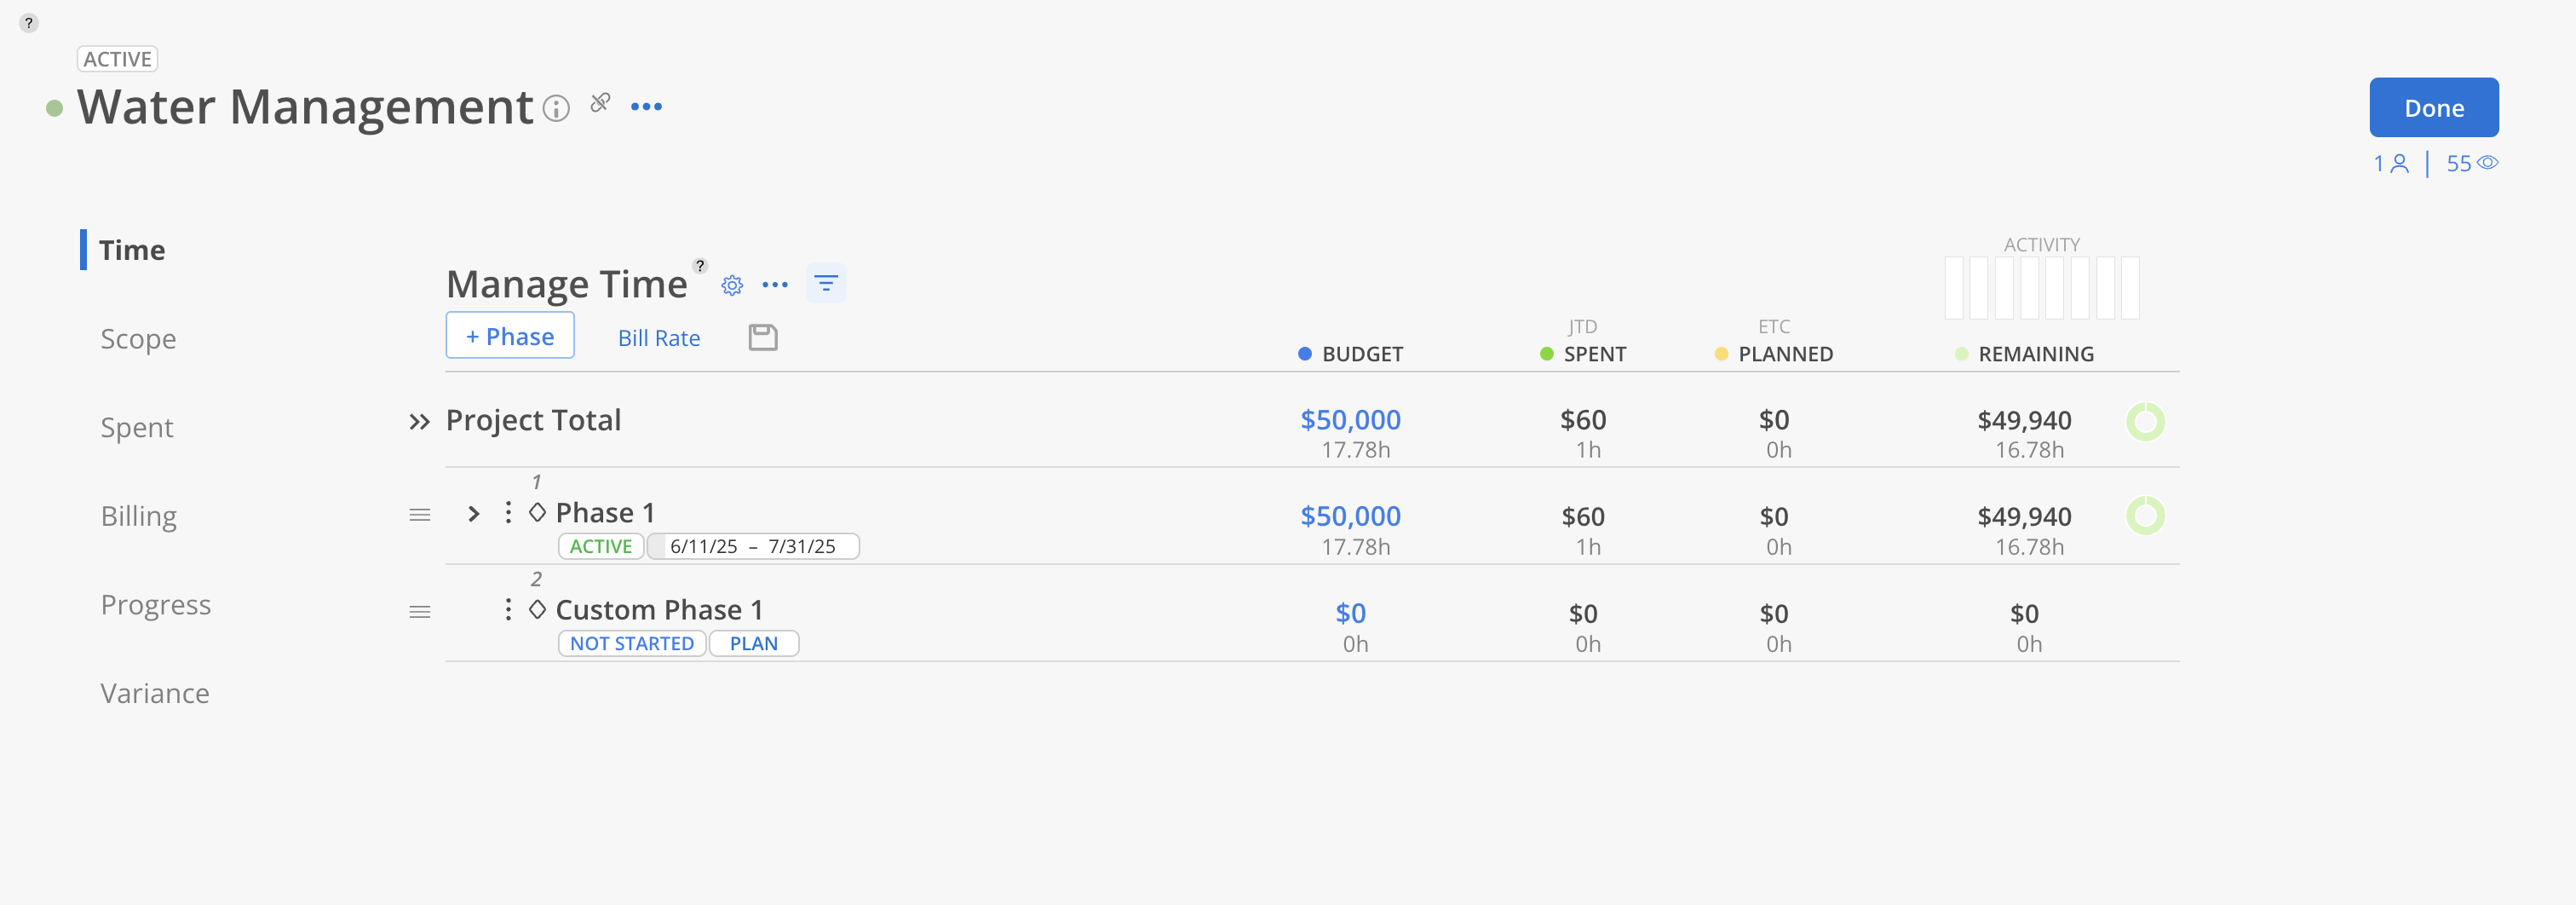
The modal looks like this:

There are several tabs on this modal that have their own unique functionalities:
Time: This tab allows for the management of time and financial budgets for your project and provides options to modify project budget settings. Phases, Subphases, and Work Categories can be added and assigned budgets. It also provides a view of the planned and spent hours or funds for each Phase, Subphase, or Work Category, along with the remaining budget.
Scope: This tab allows you to manage the Scope of work for your project. You can add Scopes to Phases and Subphases, and set budget on each Scope.
Spent: This tab allows you to view the timesheets for the project members. You can view the timesheets by phase or member, and see the hours that each member has worked.
Billing: This tab allows you to keep a history of the billing estimate for the project. You can also see the billing estimate on the profit report.
Progress: This tab allows you to visualize the progress of the project. You can see the project fee amount and spent, planned, budget estimate amount or percentage shown as individual lines or bars on the chart across the year depending on which view you are on.
Variance: This tab allows you to see the difference between the actual spent and the planned hours or budget. This can help you identify areas where costs are being incurred and make adjustments to the budget as needed.