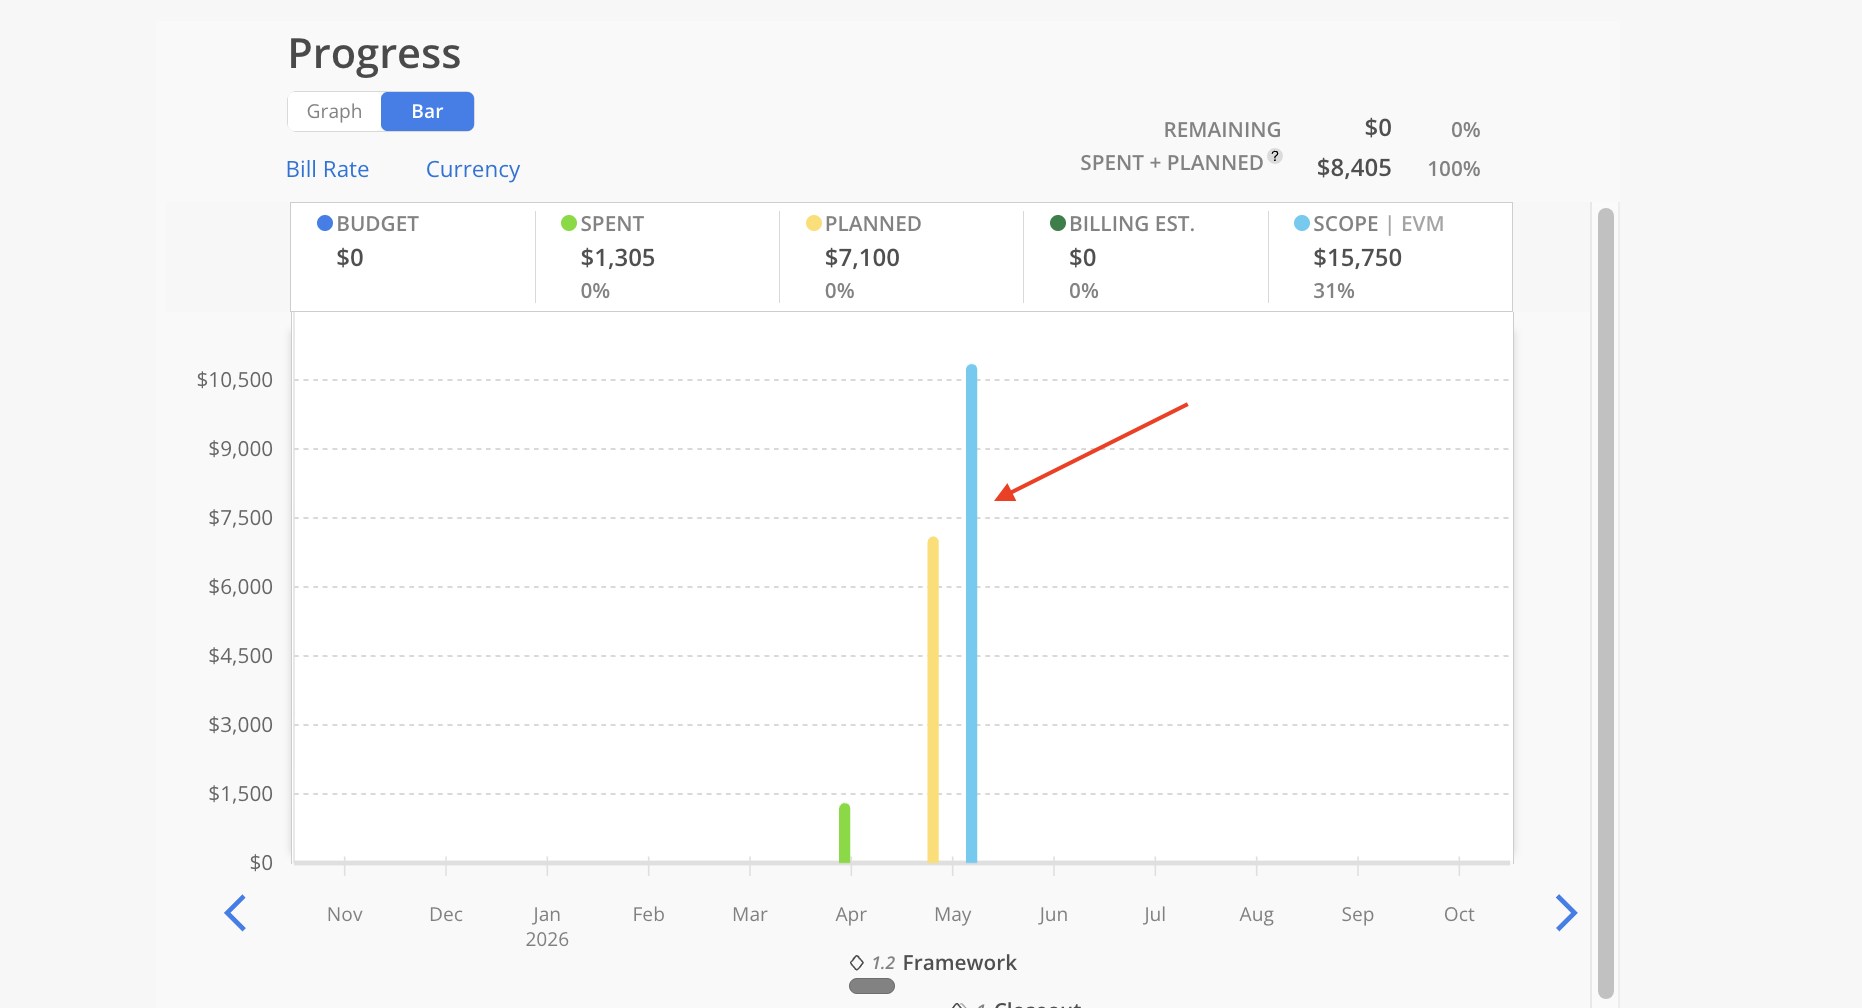
A clear visual graph presents Spent Time, Planned Time, Project Fee, and Billing Estimates. It also highlights profitability by comparing the Invoice Amount to the Time Spent. The combination of Spent and Planned amounts represents the Estimated At Completion (EAC), providing a forecast of the total expected cost or effort upon project completion.
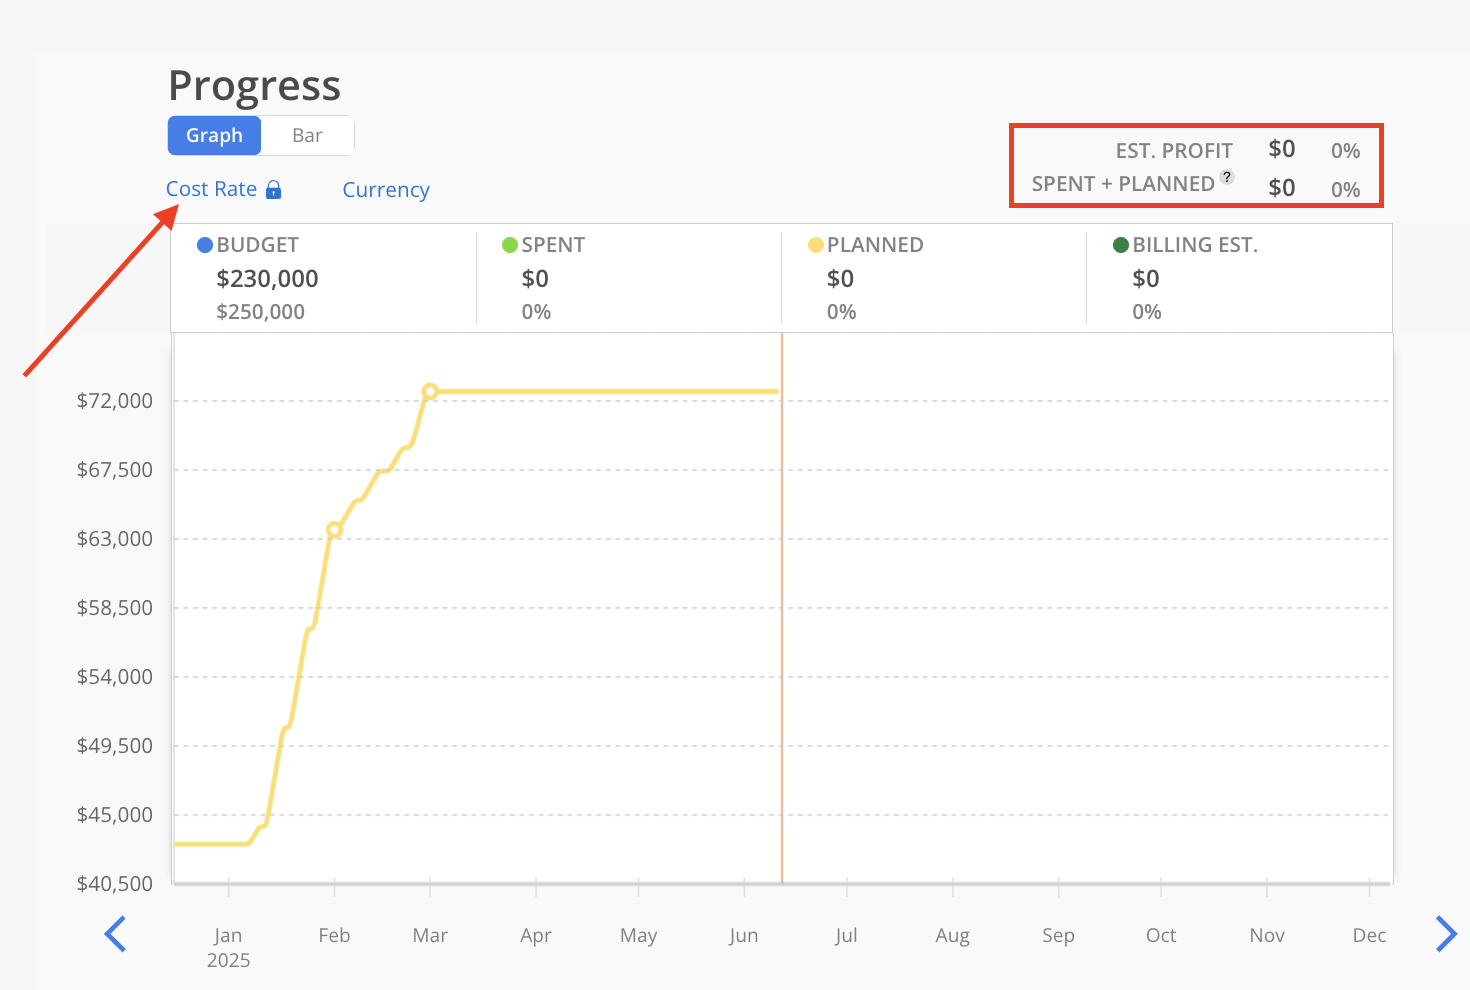
At the top, use the toggle to switch between viewing the data as a line graph or a bar graph.
The Display Rate button allows switching between Cost Rate and Bill Rate. Viewing Spent Time and Planned Time with the Cost Rate provides clearer insights into project profitability. Mosaic’s Work Plans or Planned Time help forecast profit based on long-term planning.
The Currency button enables toggling between currency amounts and percentage values.
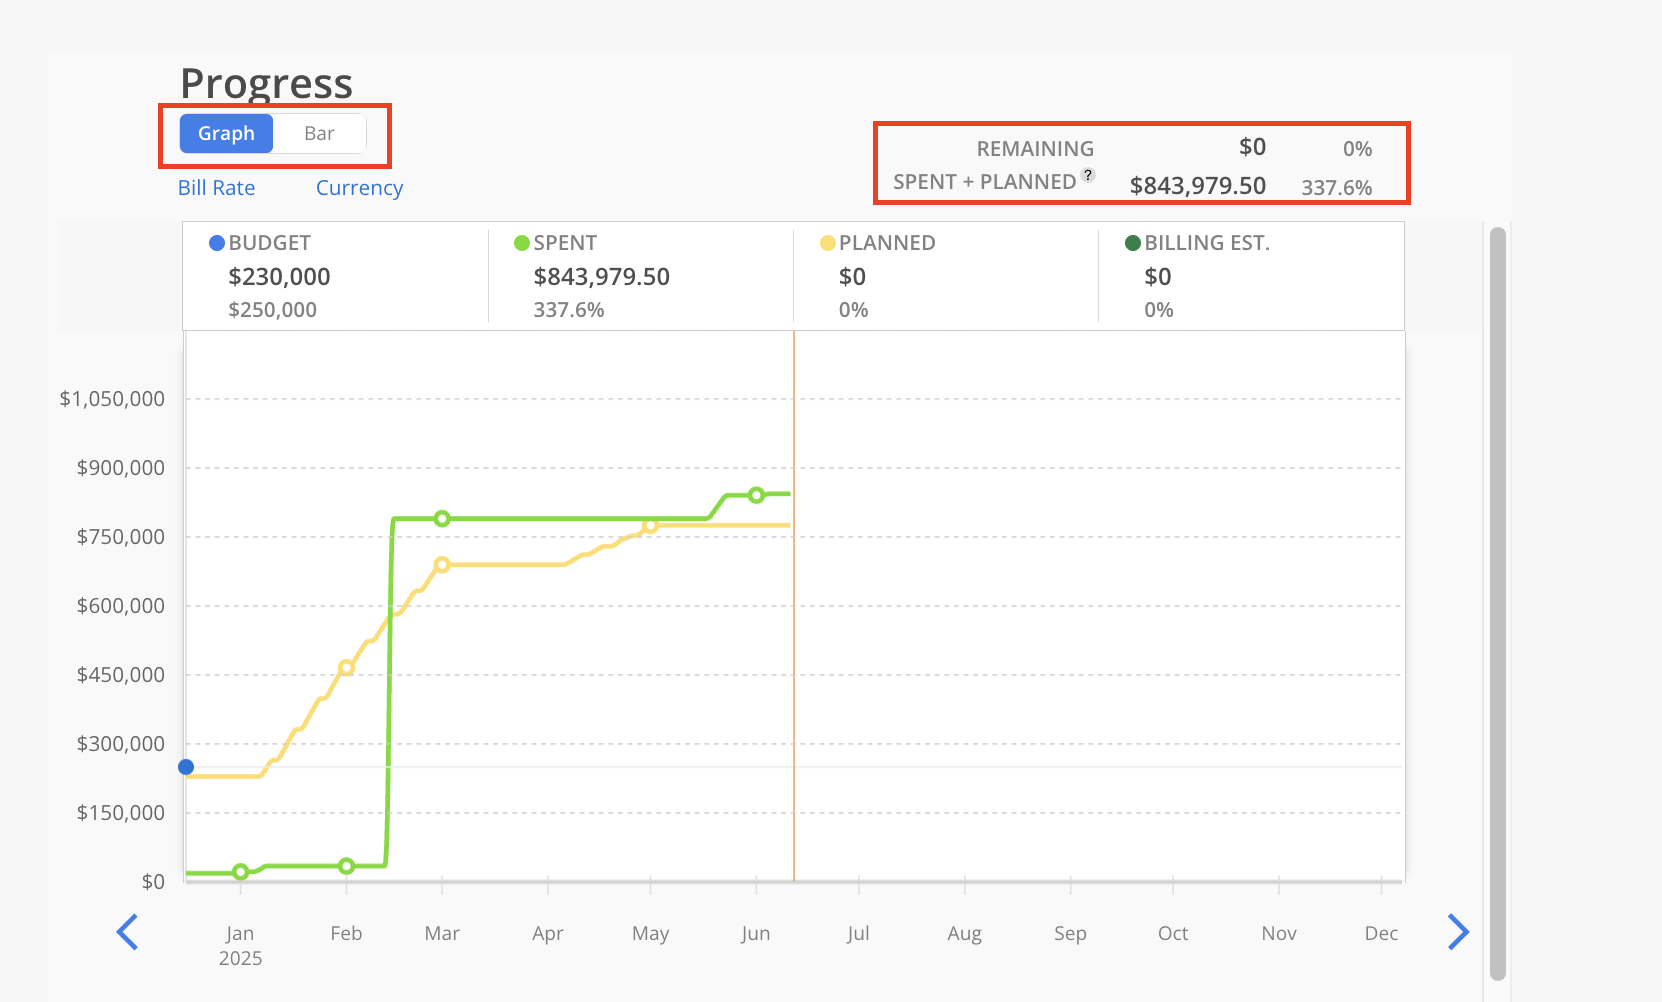
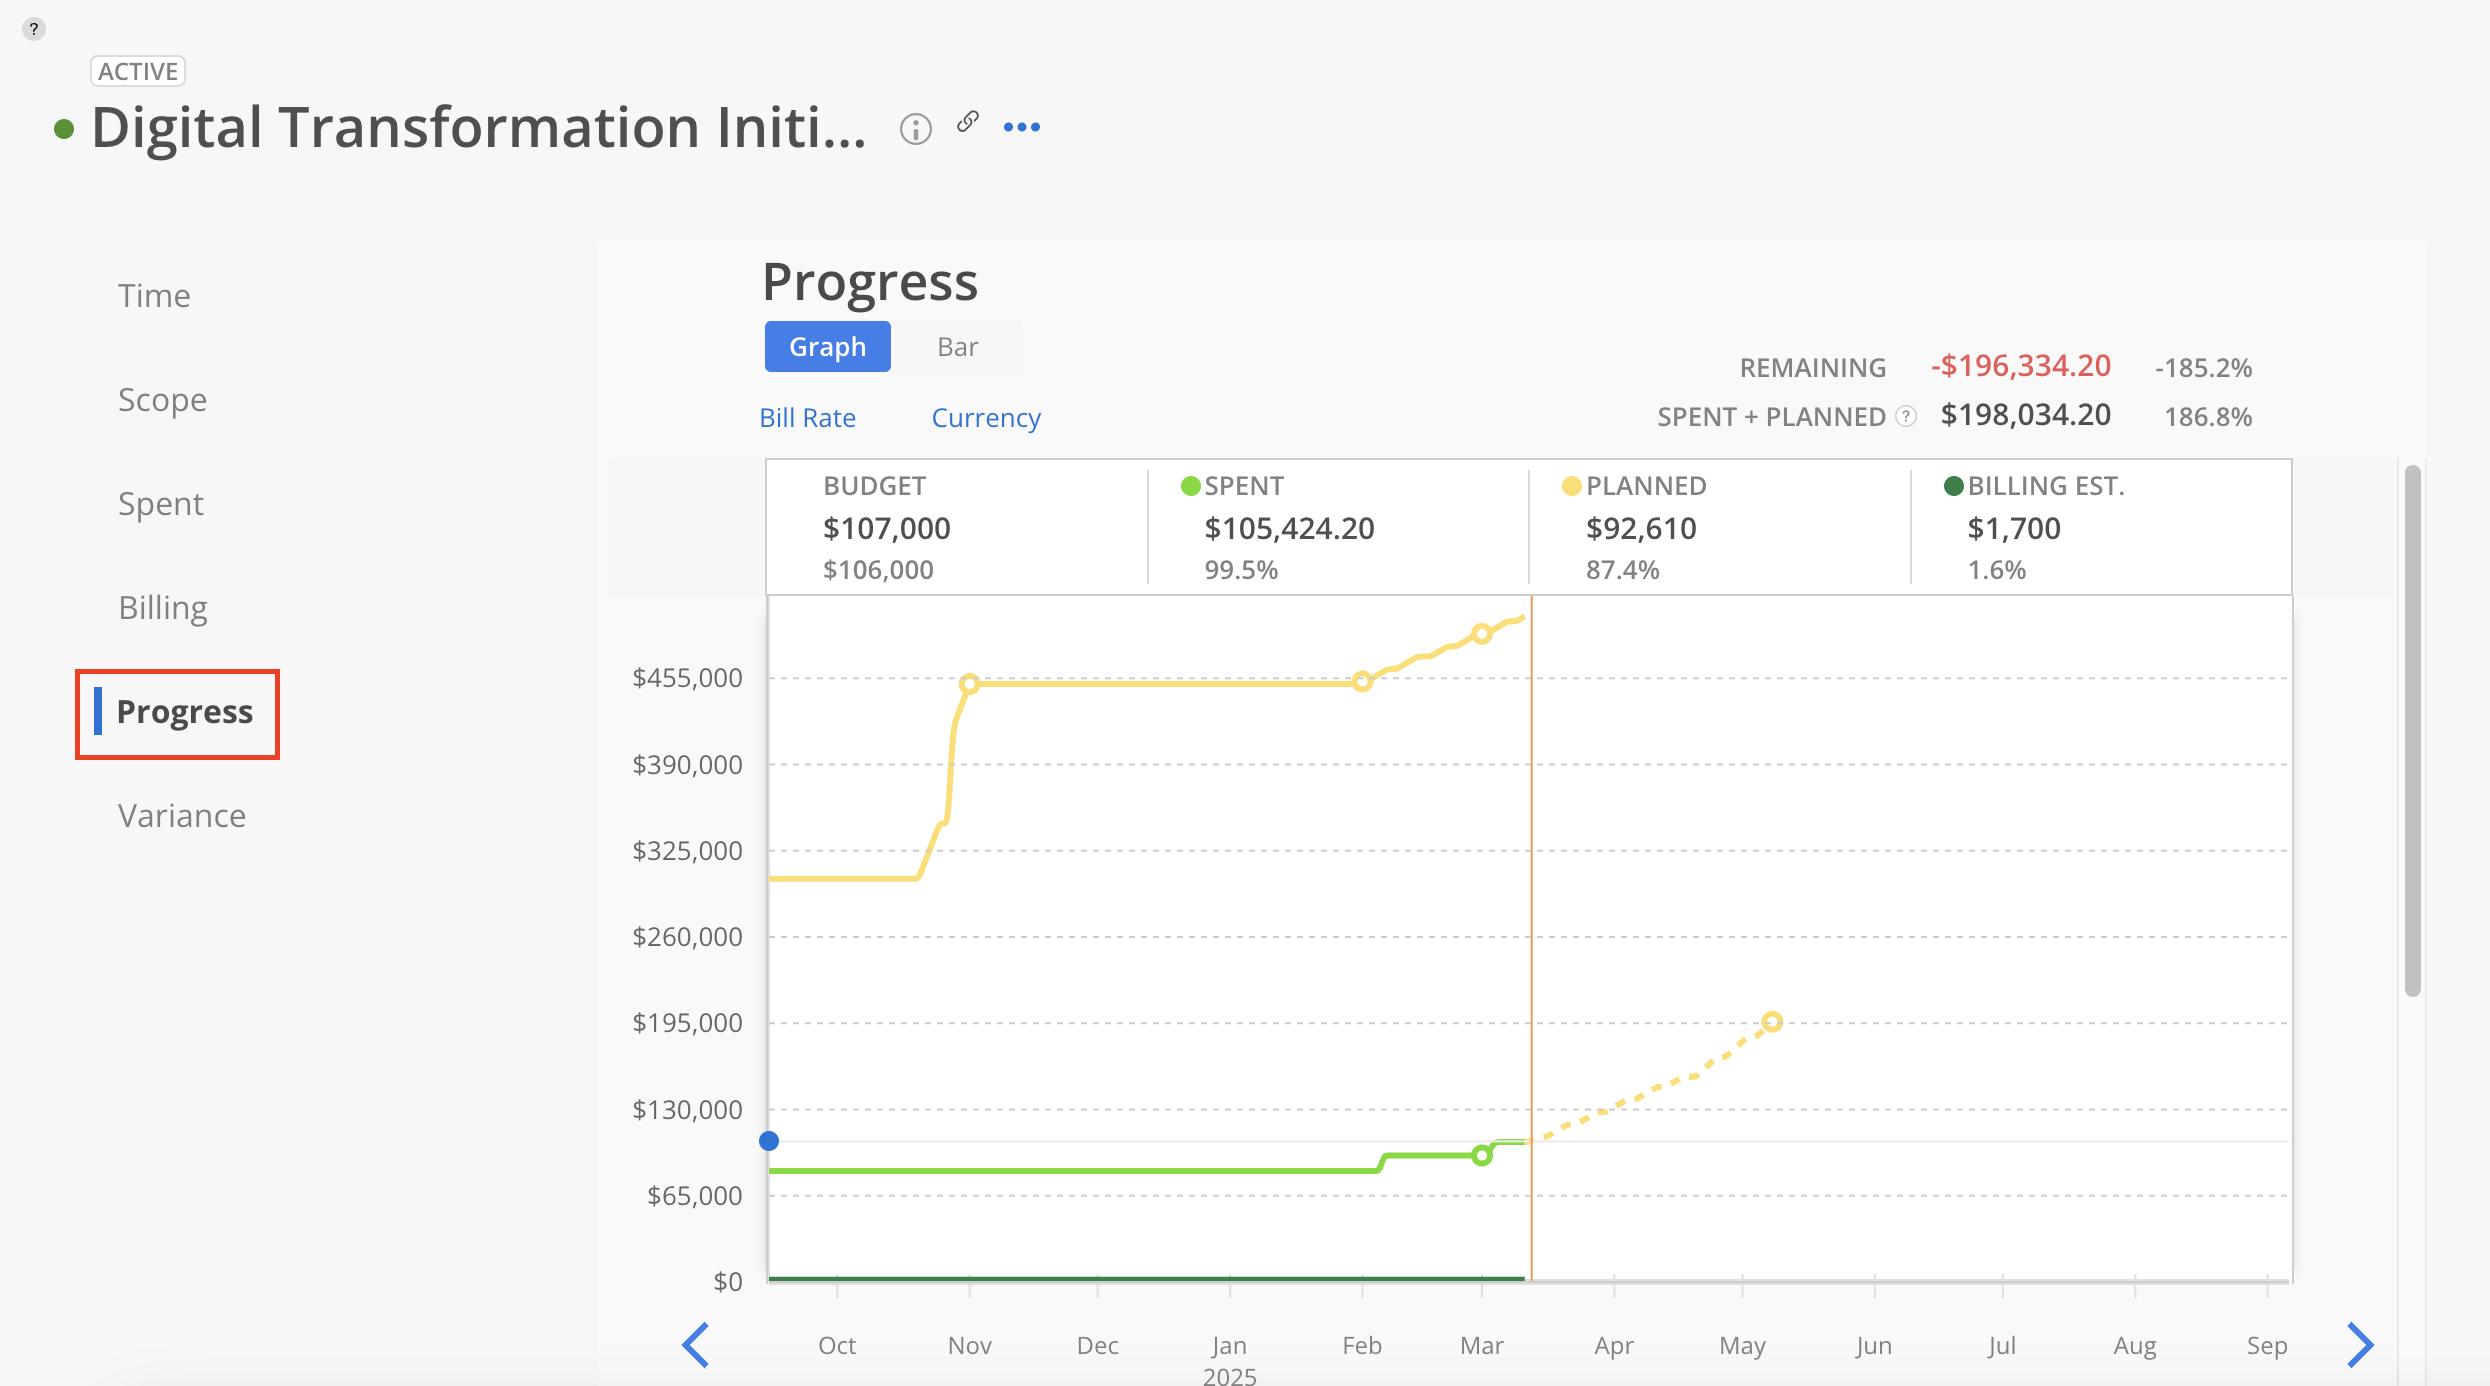
On the top right, the Remaining amount or Estimated Profit will be displayed, depending on whether the view is set to Bill Rate or Cost Rate. Below that, the Spent + Planned amount will be shown, providing a clear comparison of allocated resources.
At the bottom of the chart, a timeline displays all Phases and Subphases, providing a visual representation of their schedules. Use the left and right arrows to navigate through past and future months for a broader view of the project's progress.
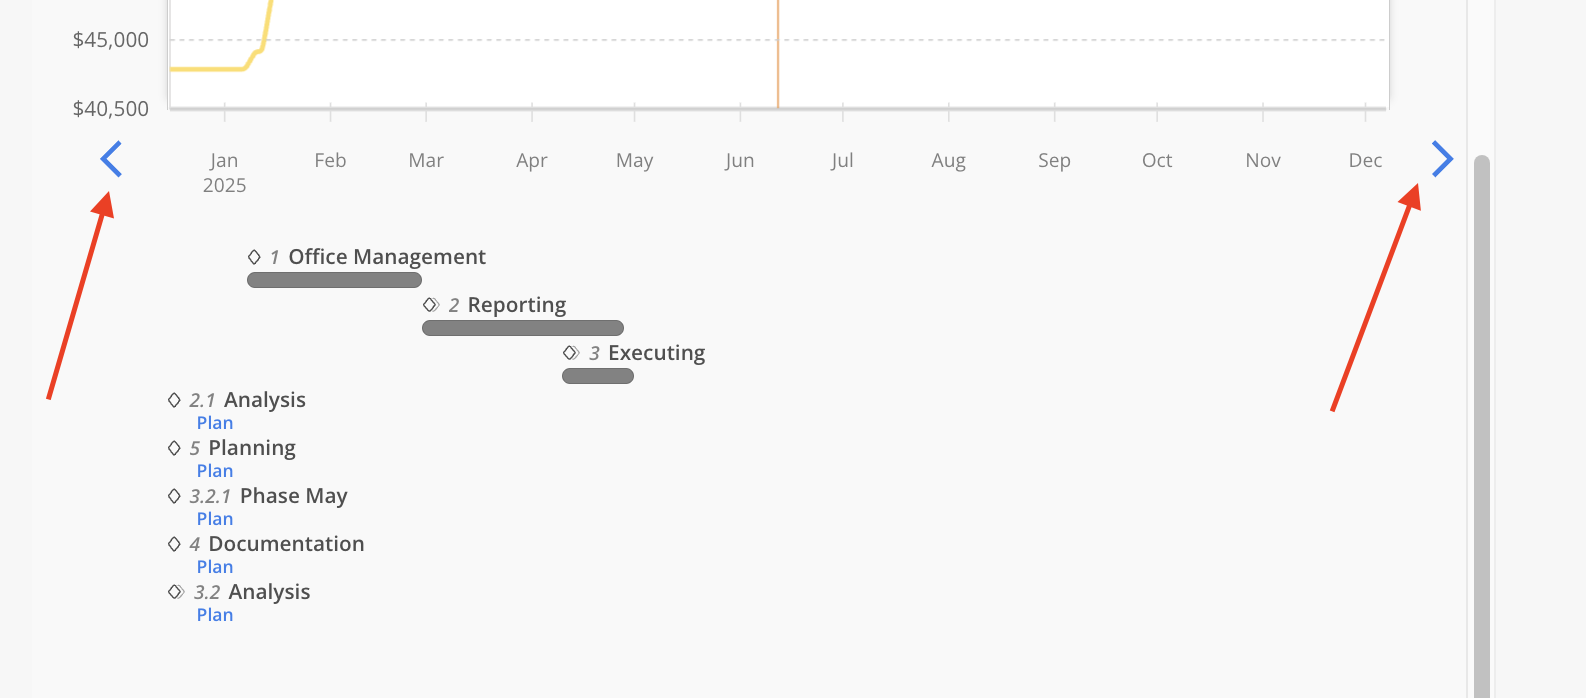
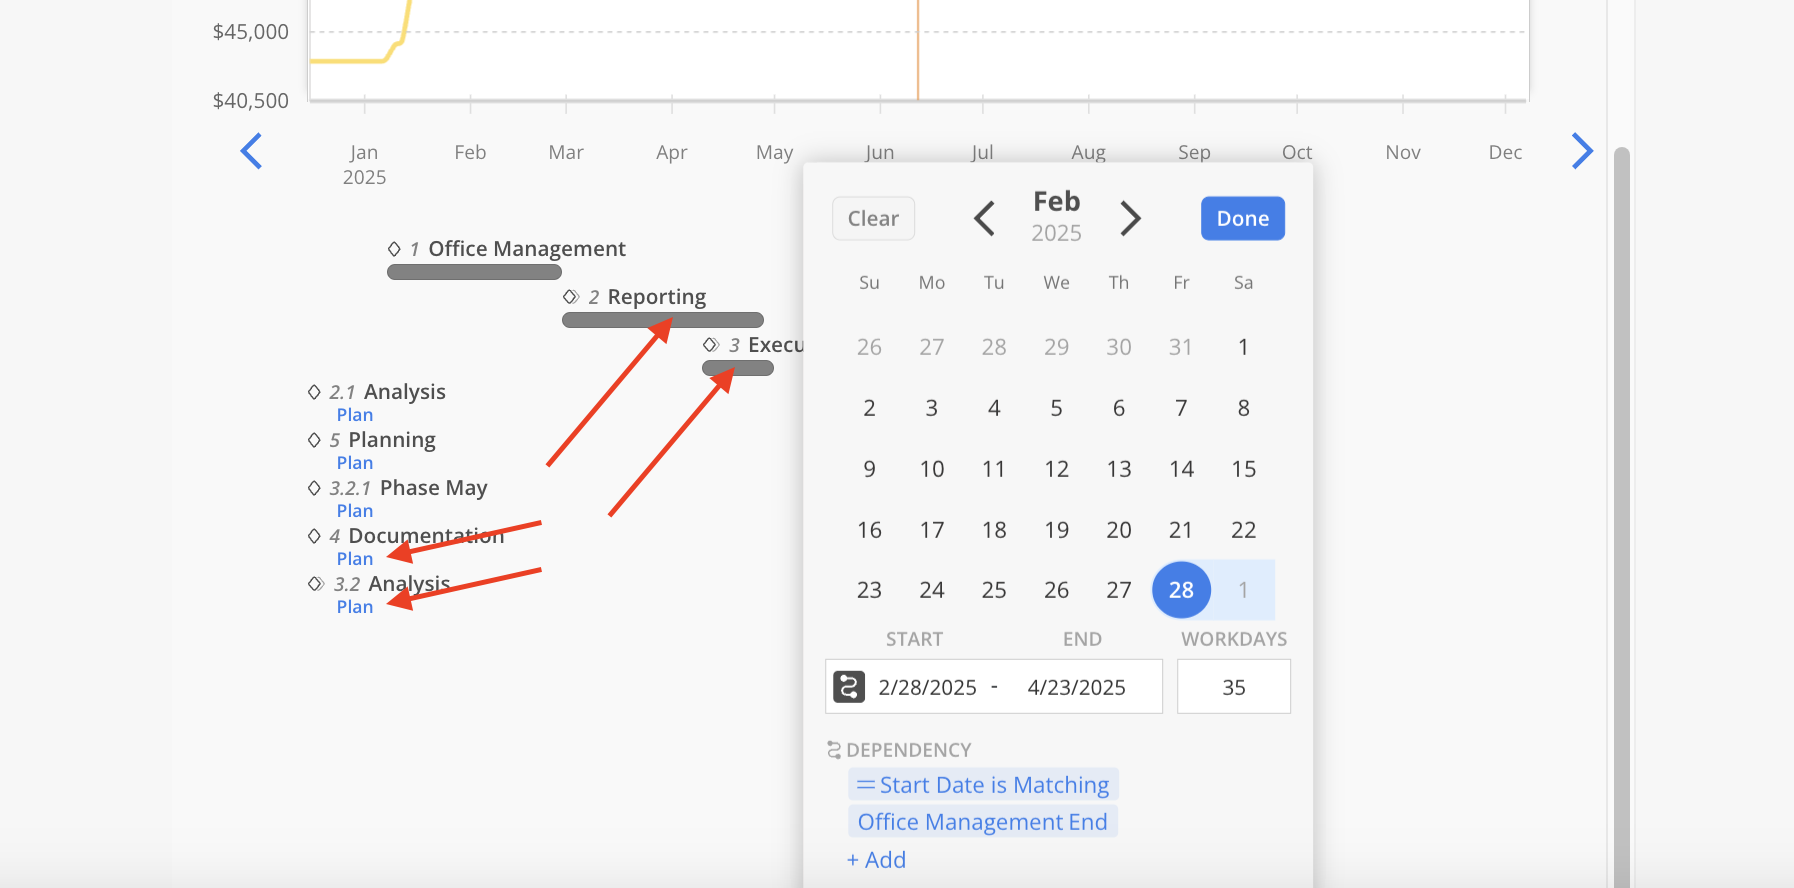
Click on the bars to adjust the start and end dates for the Phases. Click Plan to set dates for the Phases that have no planned dates.
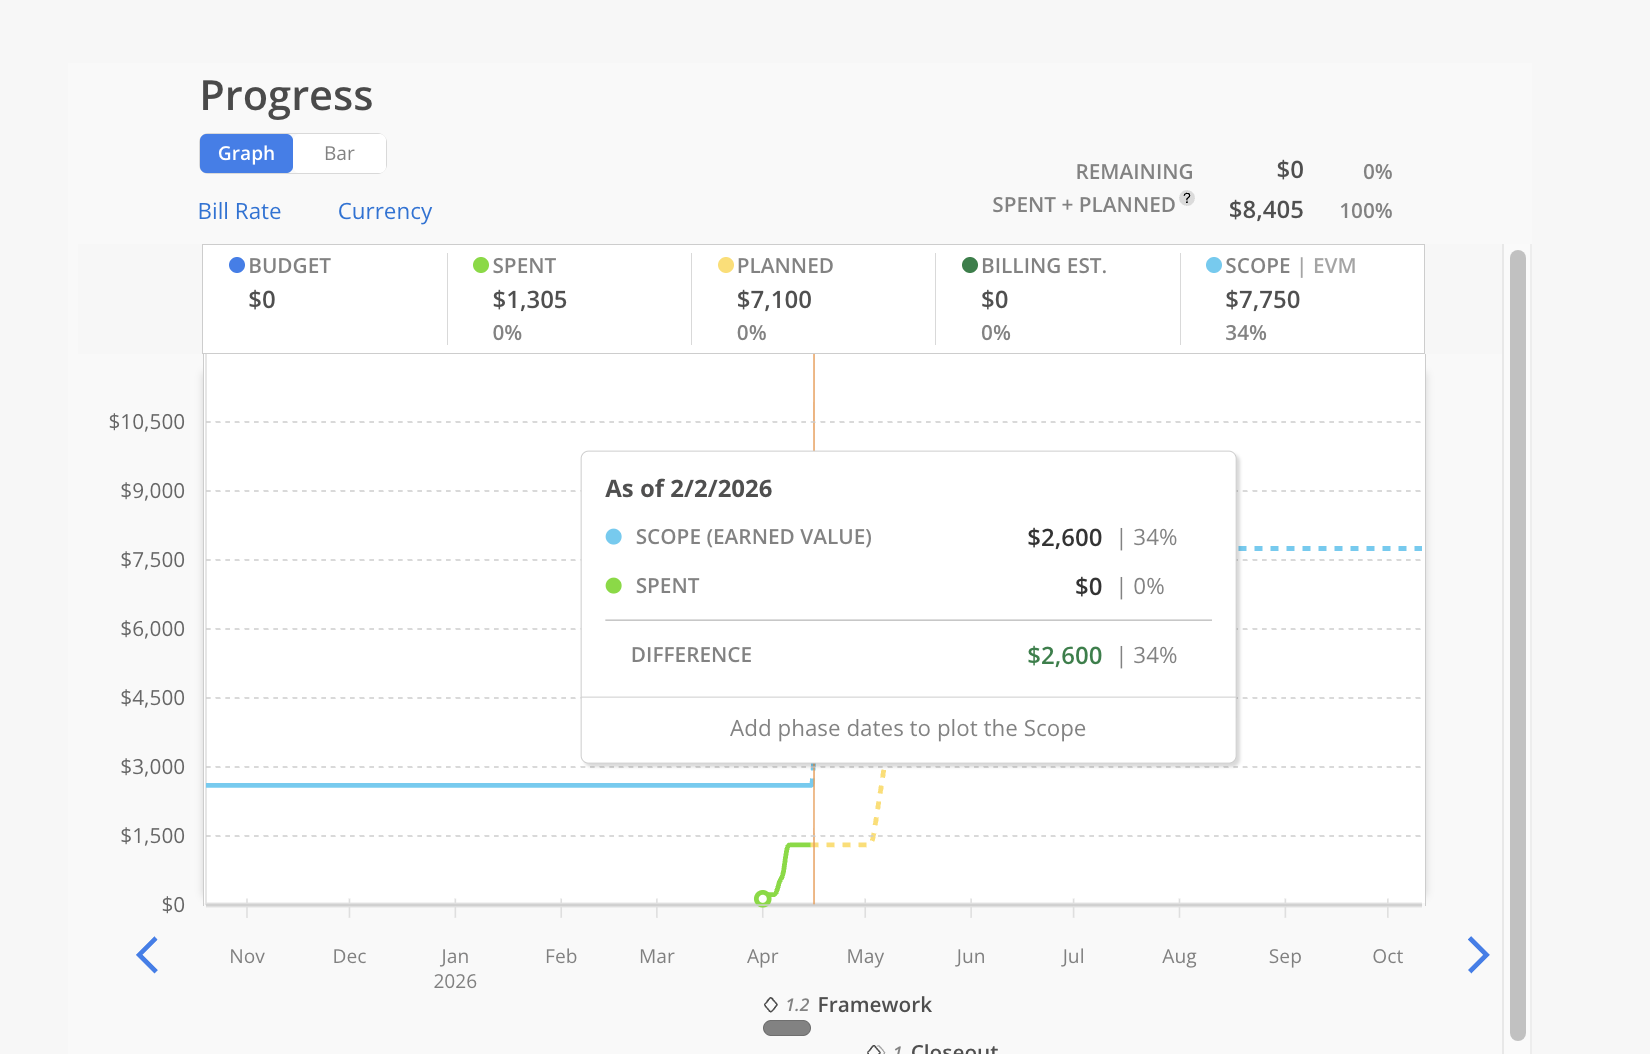
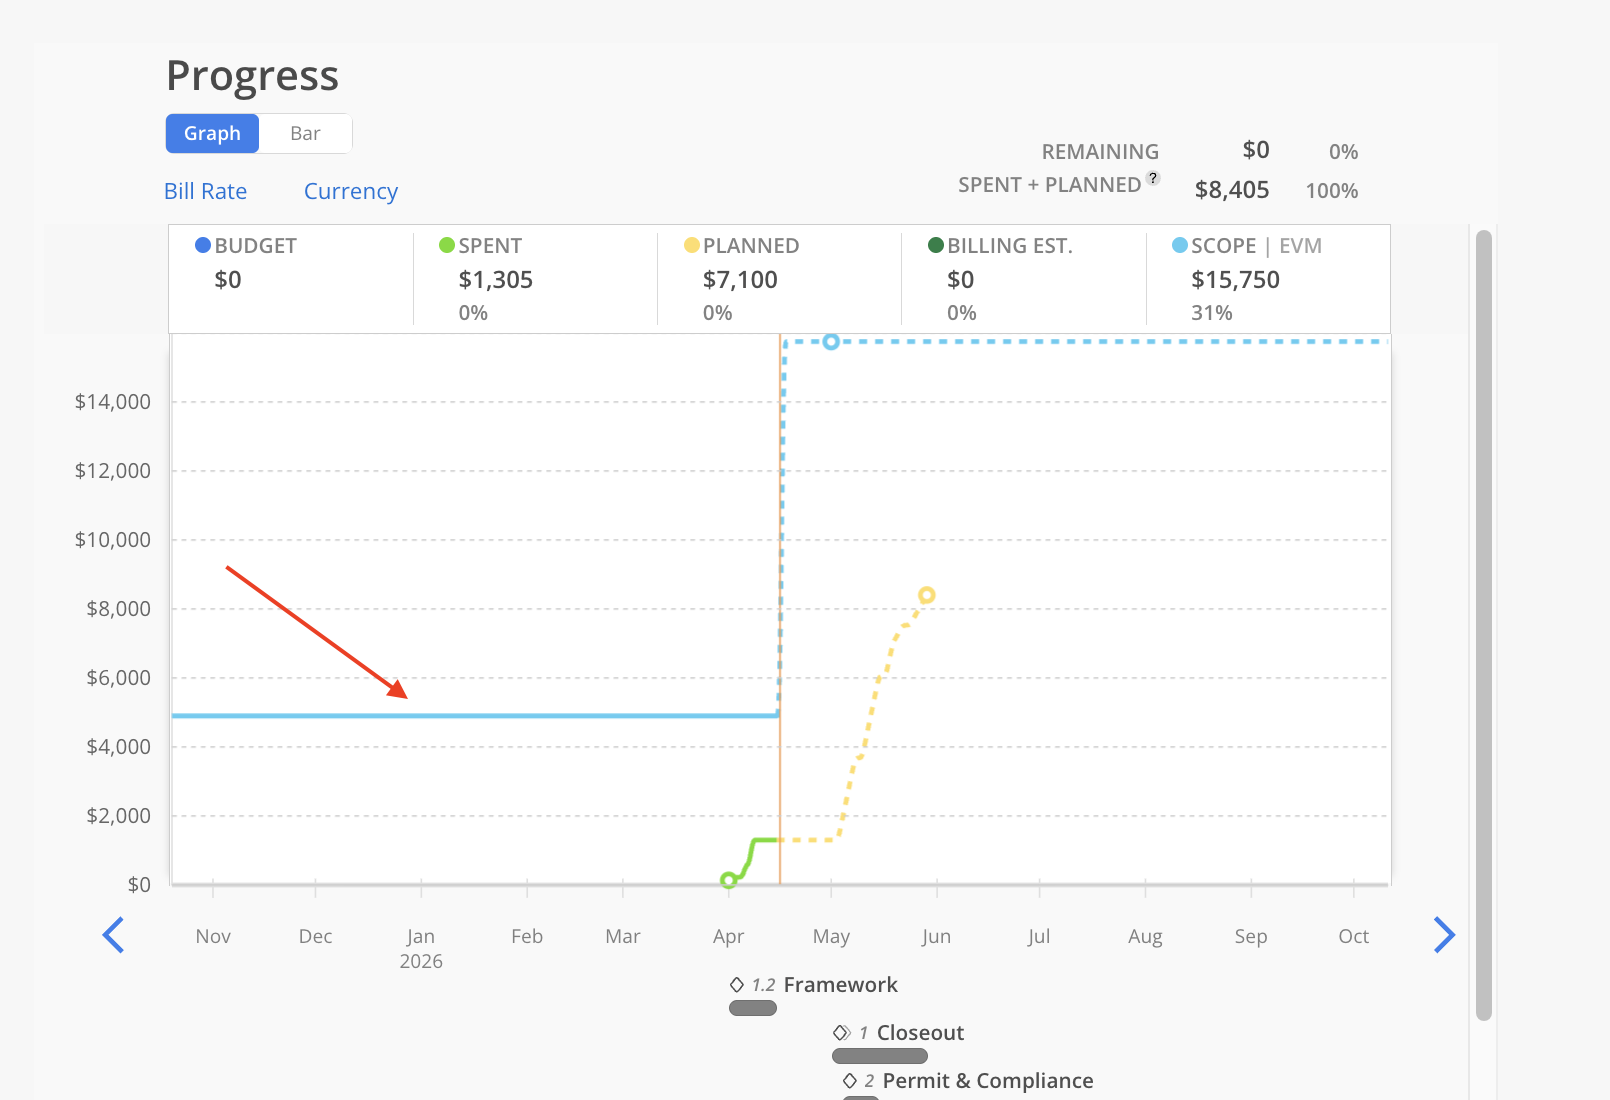
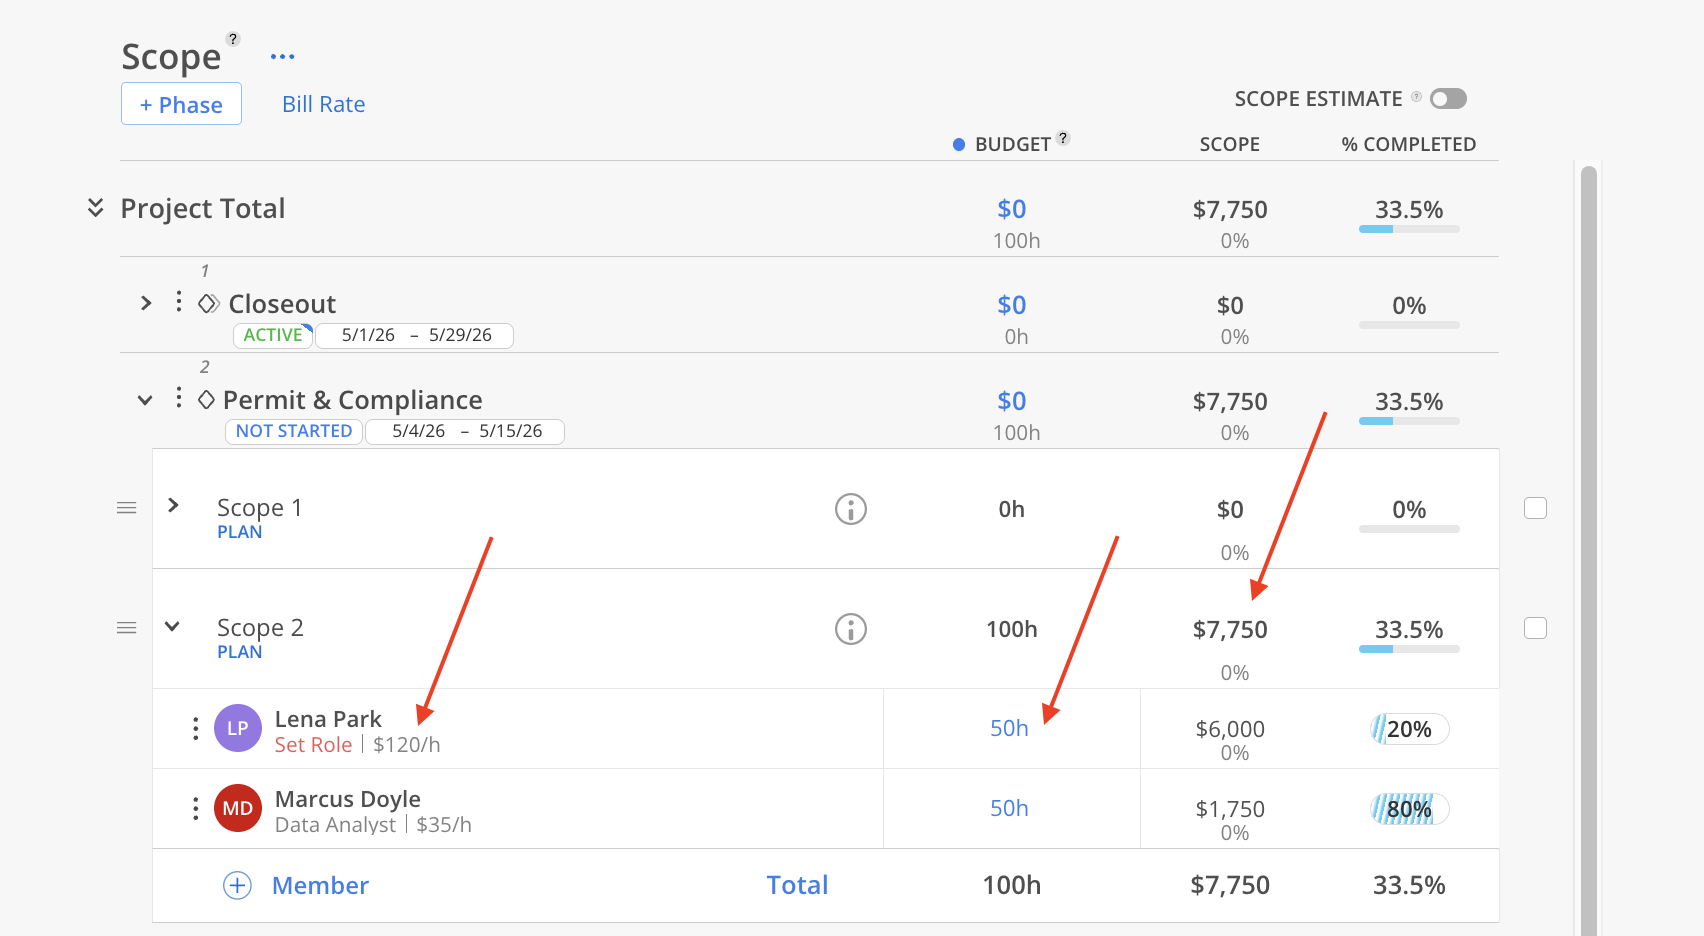
Scope (Earned Value) data to the Profit chart inside the Budget Modal. It helps you compare how much work value has been earned on a project versus how much has been spent — a core concept in Earned Value Management (EVM).
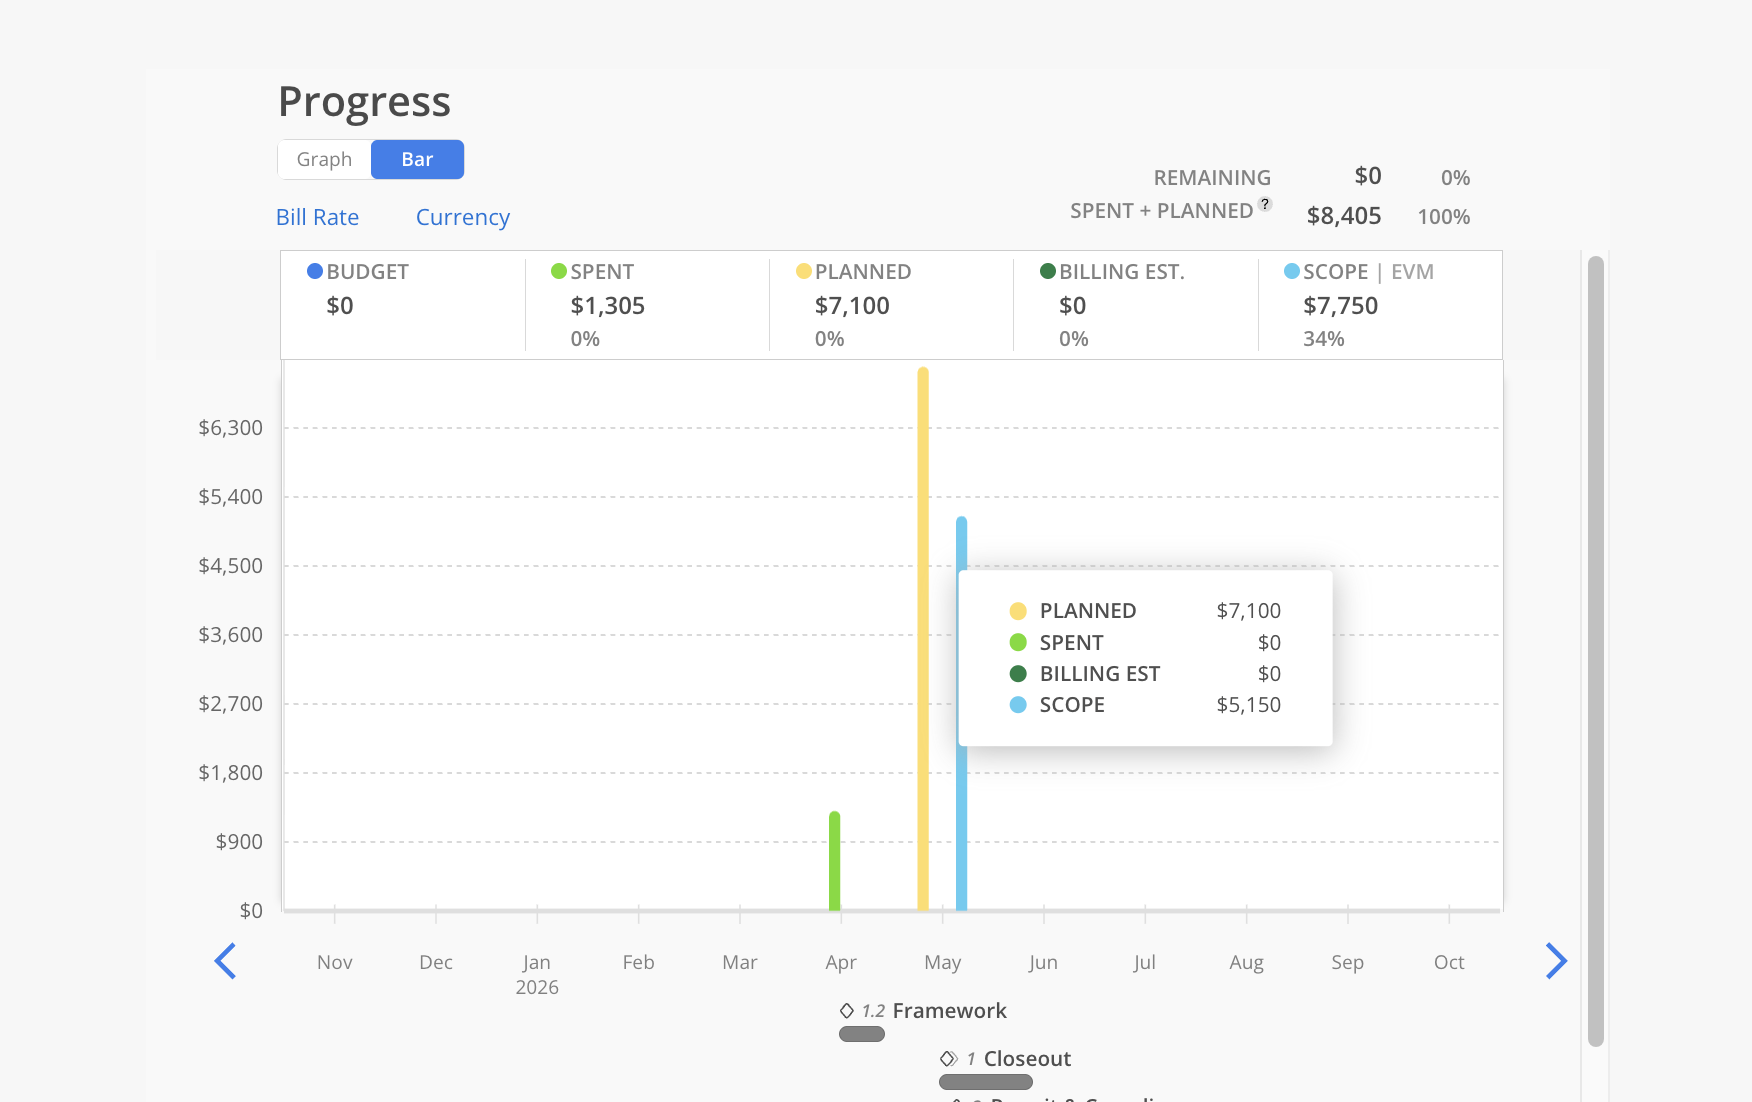
A cyan color line/bar labeled SCOPE will show on graph and bar chart
Solid line: Scope earned so far (past — up to today)
Dashed line: Projected scope going forward (future)
For the scope bars and lines to show on the chart, your project needs:
Scopes with budget values — The project must have scopes that have dollar amounts. The members in assigned to the scope need to have rates and estimated hours assigned to them.
Phase dates assigned to scopes — If any scope is missing phase dates, the chart will show a message: "Add phase dates to plot the Scope". You can still see partial data, but the timeline won't be fully accurate until dates are added.
Hover on the line or bar to see tooltip