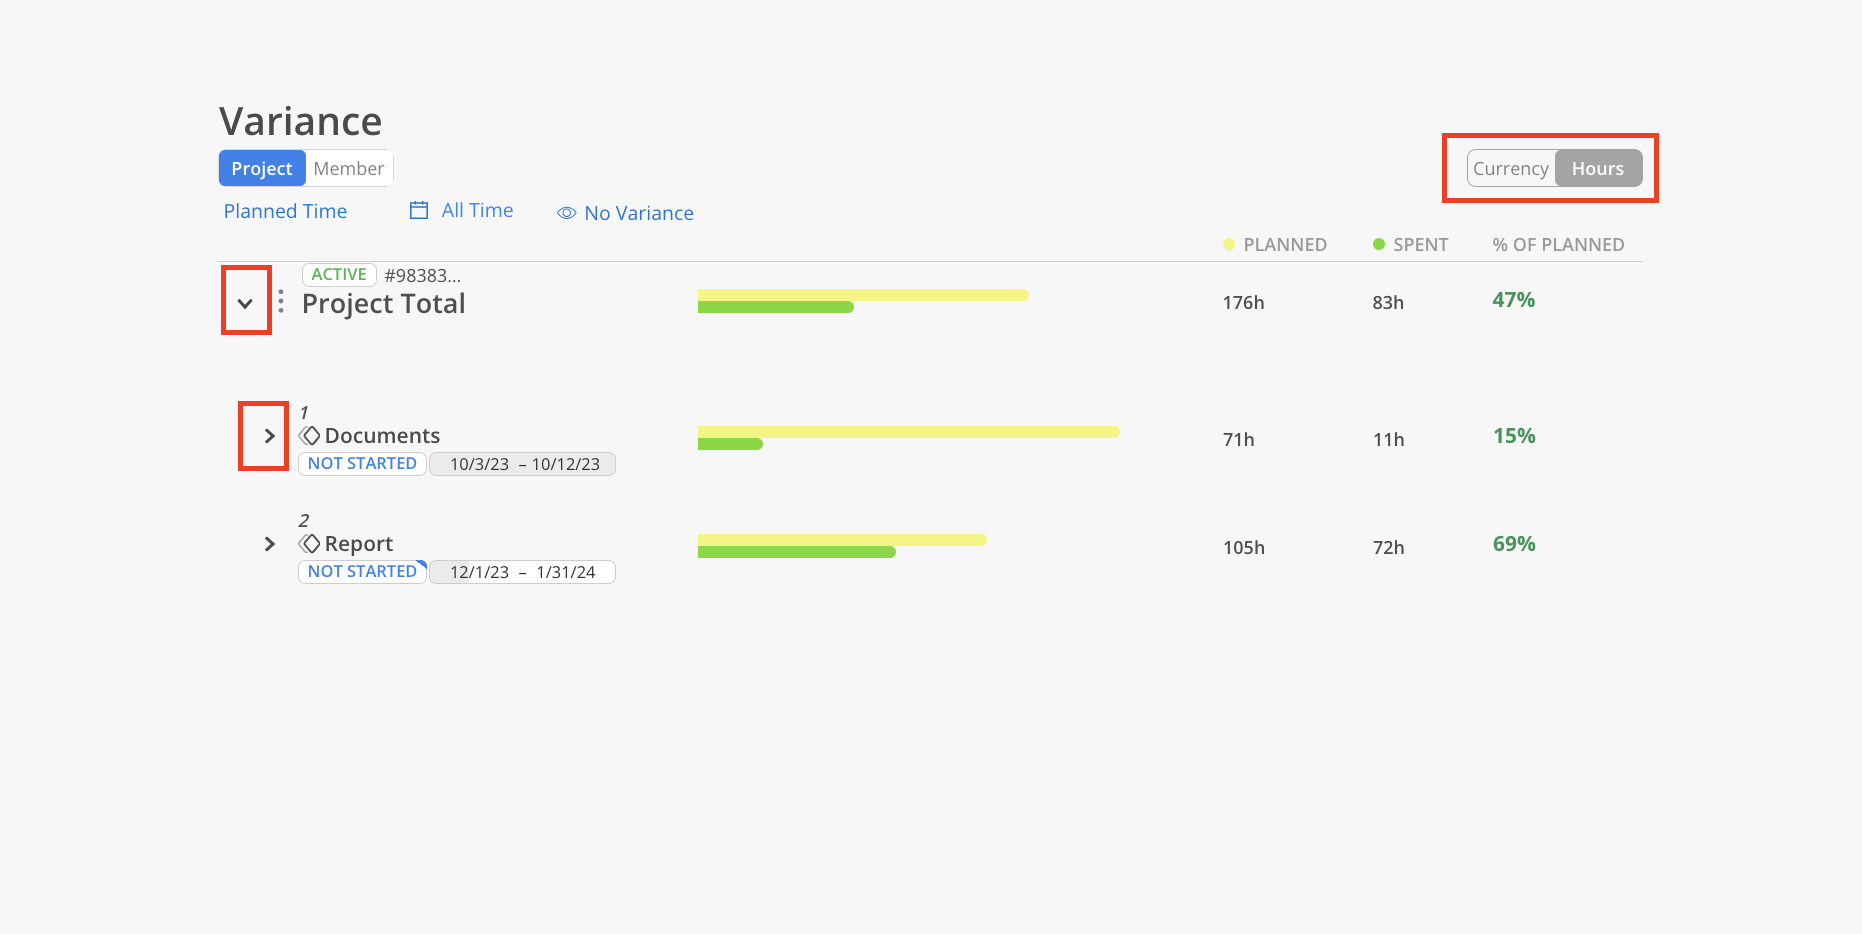
The Variance tab provides an overview of the project's initial estimates or planned time versus the actual time spent.
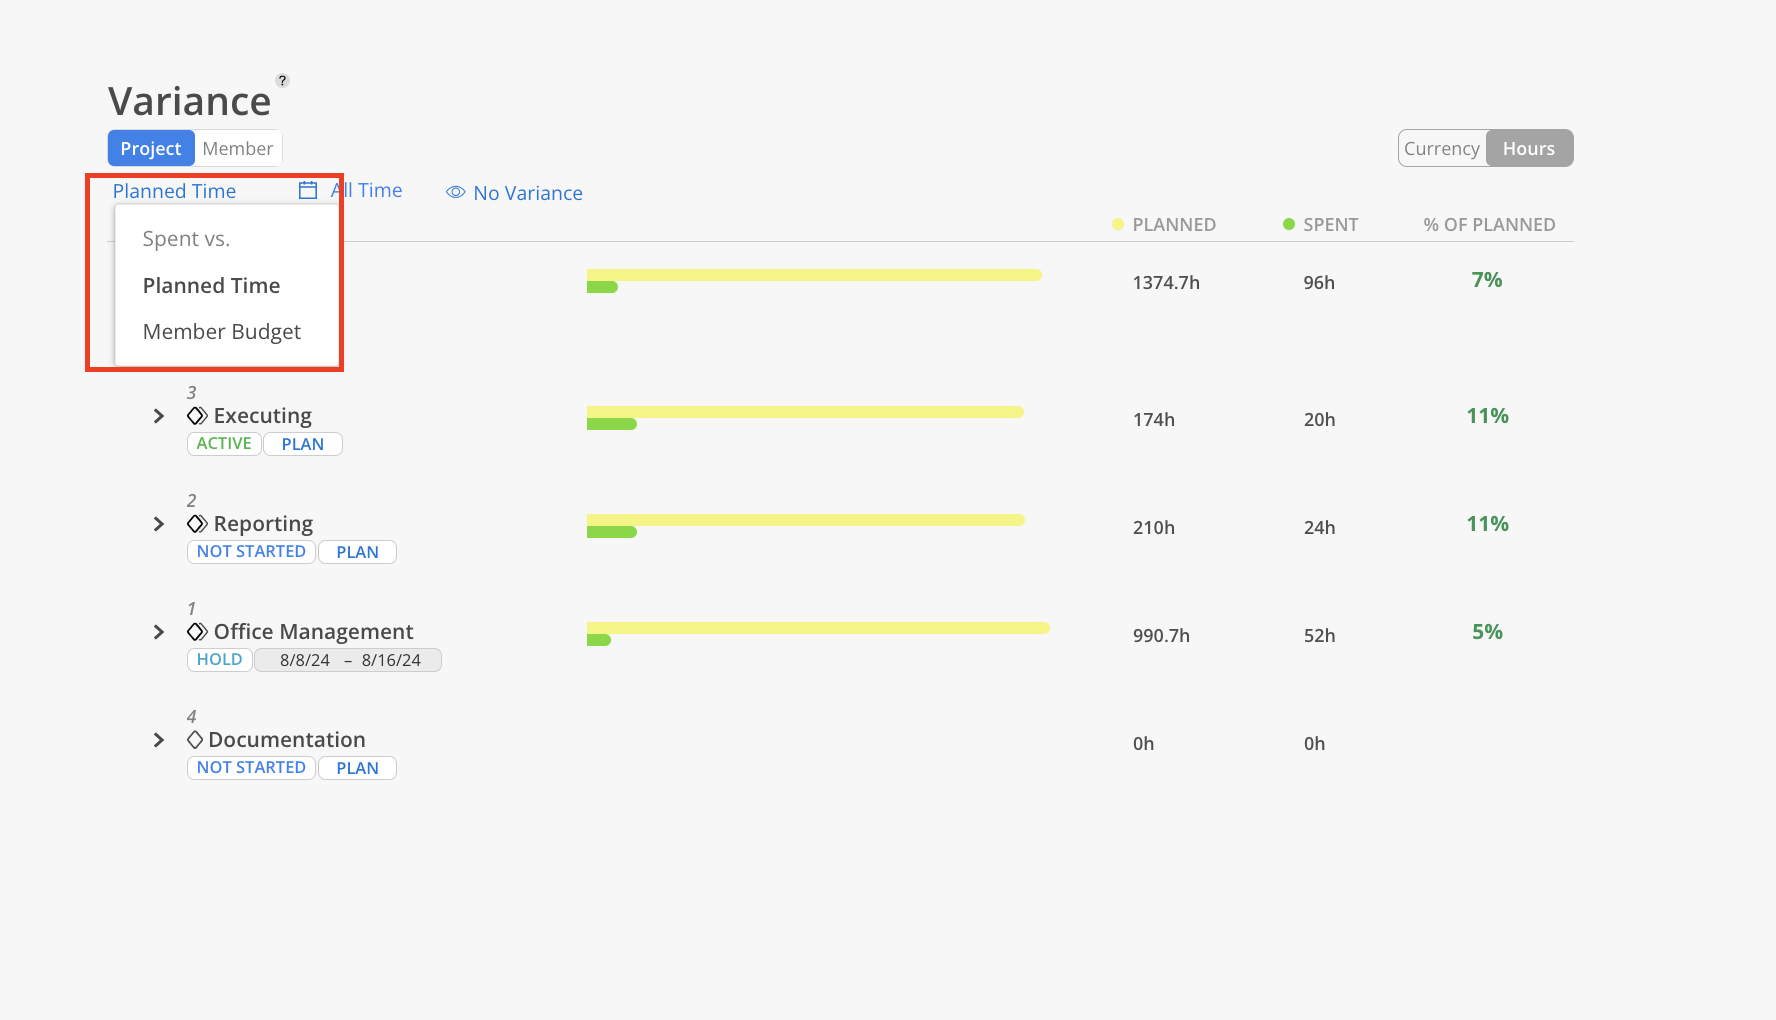
On the top, select the type of variance to display, such as "Spent vs. Planned Time" or "Spent vs. Member Budget."
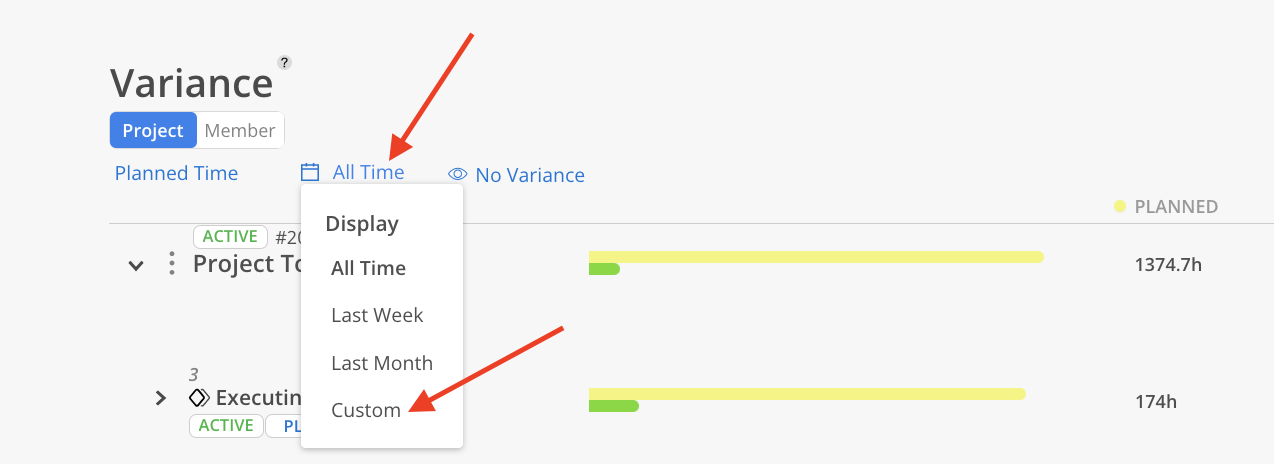
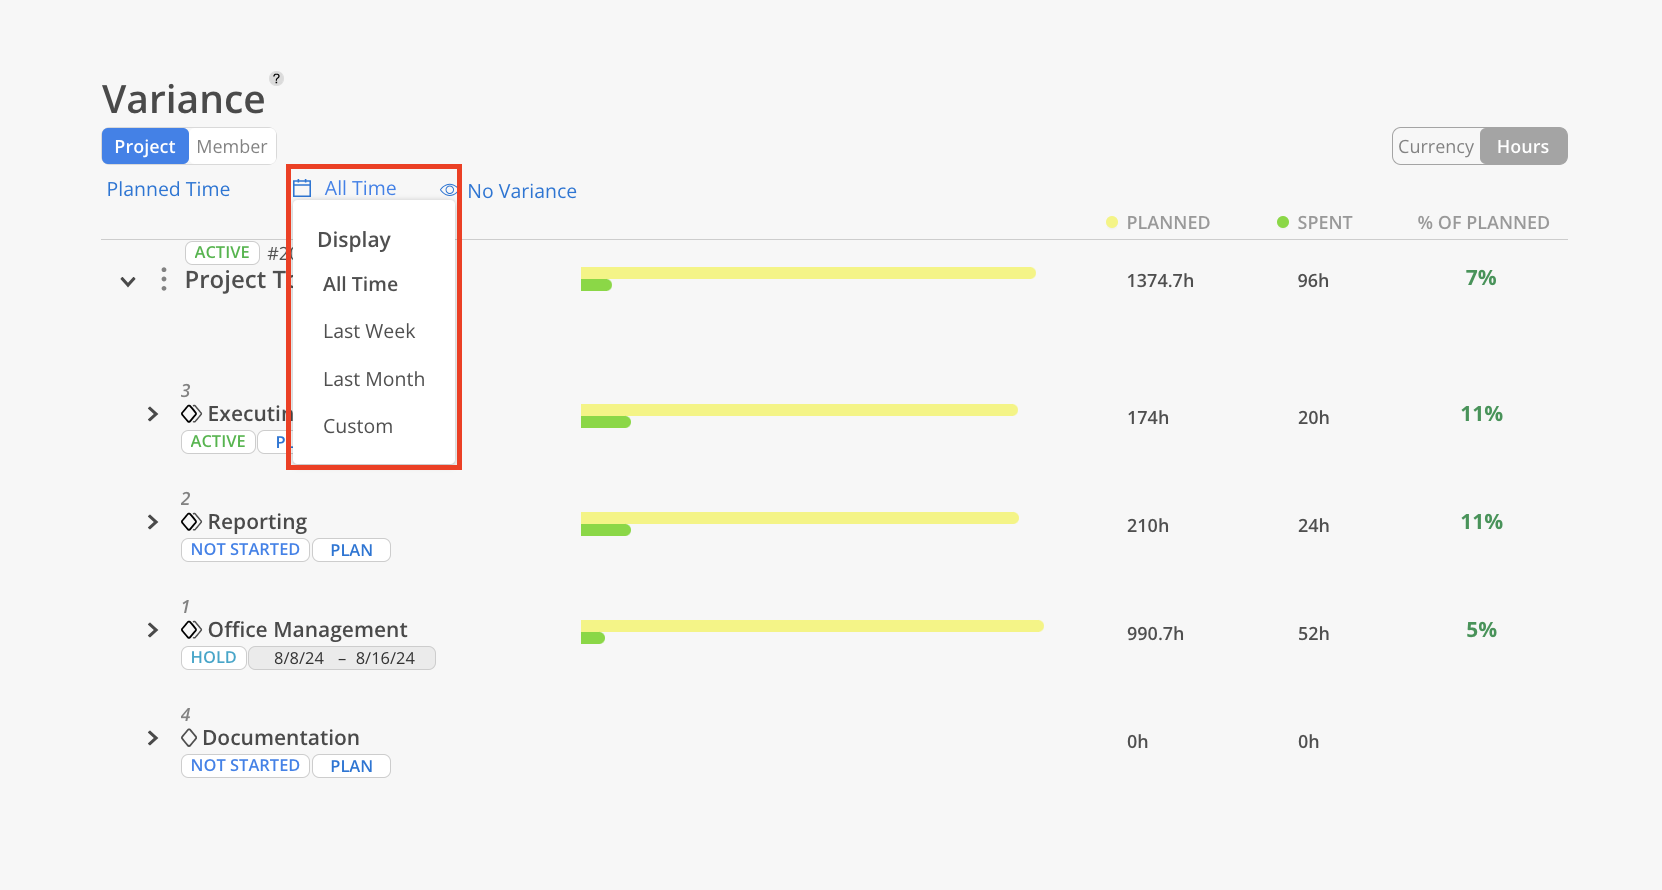
The date range for the data can be adjusted to show "All Time," "Last Week," "Last Month," or a custom range.
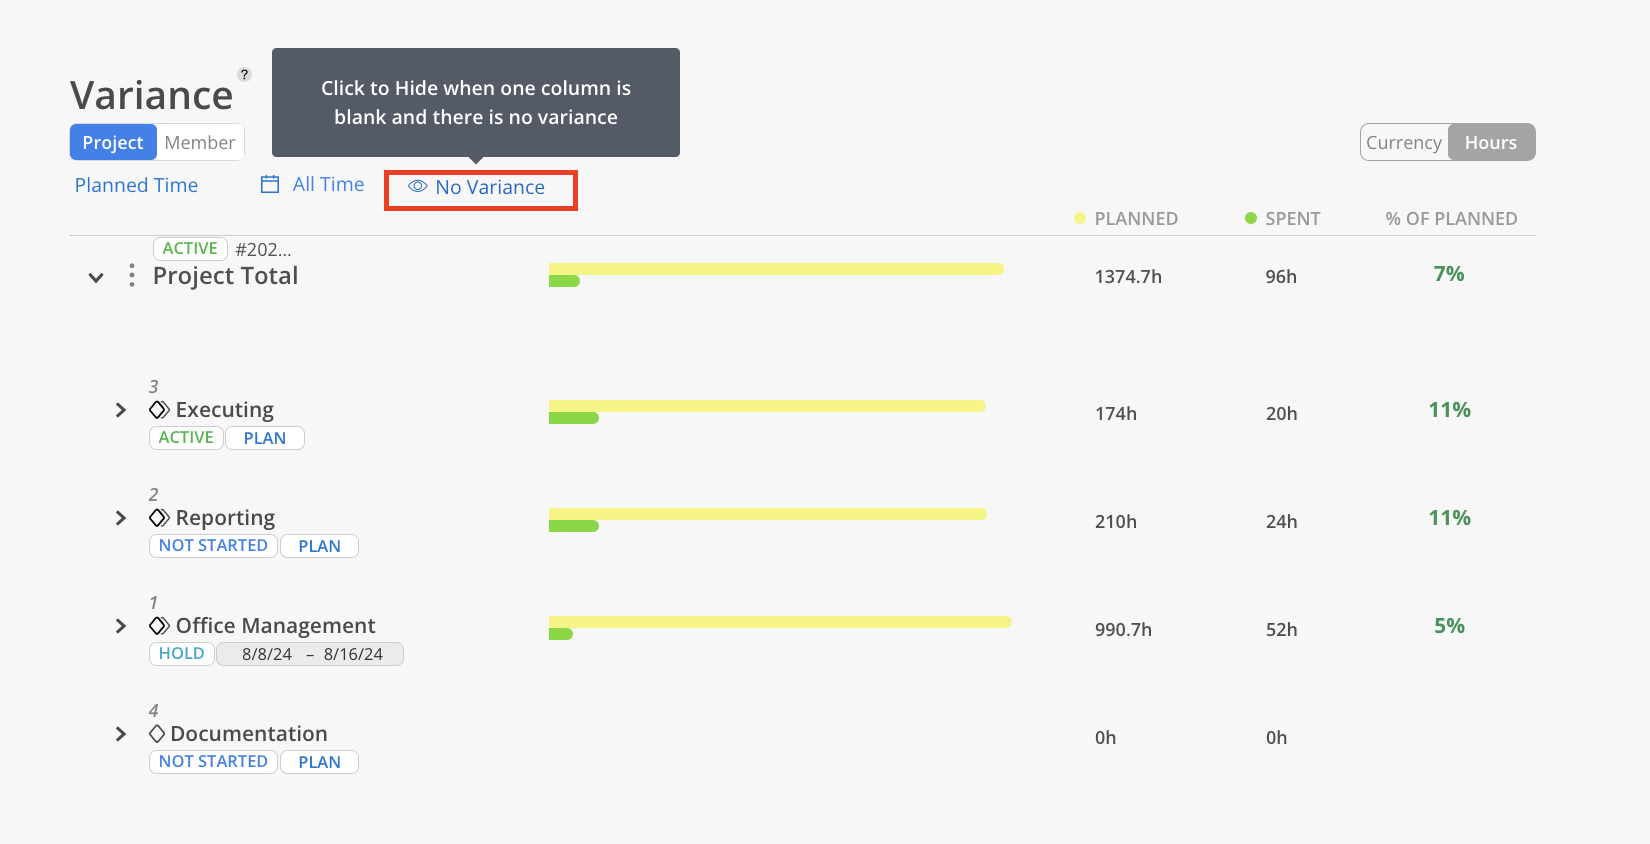
Additionally, the view can be filtered to hide phases that have no variance, ensuring a clearer focus on areas that deviate from the plan.
On the right hand side of project you will see a green or red percentage displaying the project's overall performance
green = underestimate (spent amount is below planned amount)
red = overestimate (spent amount exceeds planned amount)
Expanding a project will allow you to see the variance of each individual phase. You can then expand even further on a phase to see members of Work Categories and Subphases and how they might have contributed to the variance themselves.
You can toggle the view between currency and hours in the top right corner.
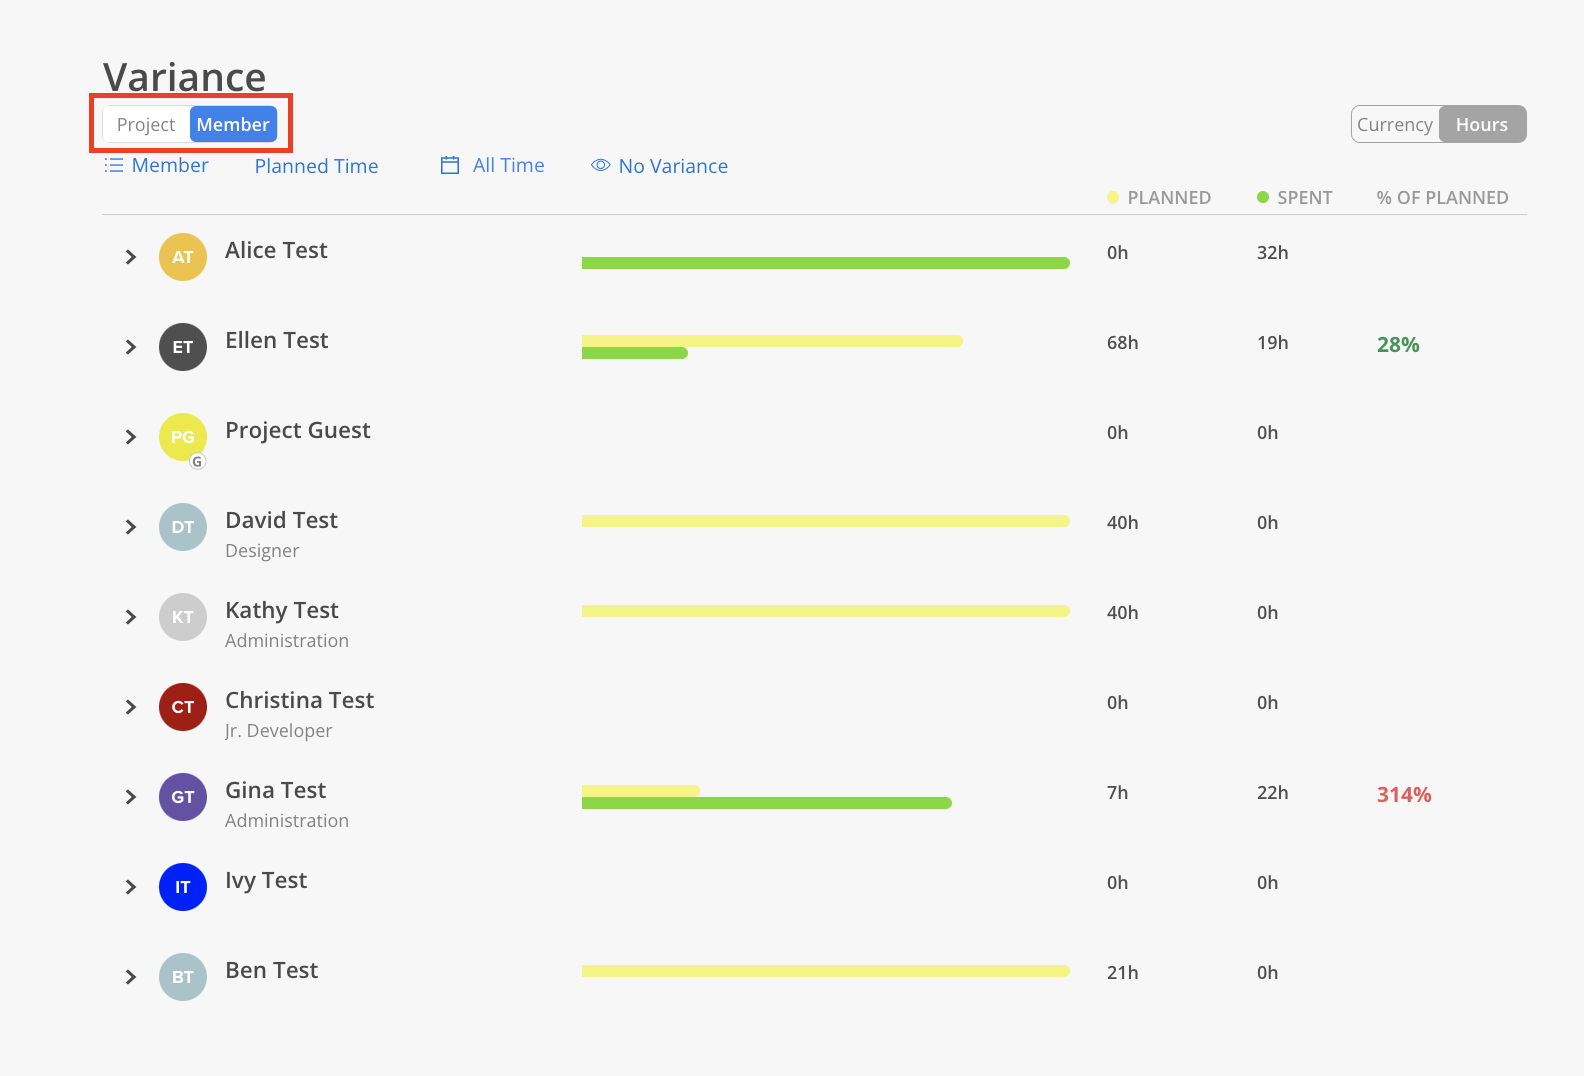
Switching to Member will show you the same report just broken down by member instead.
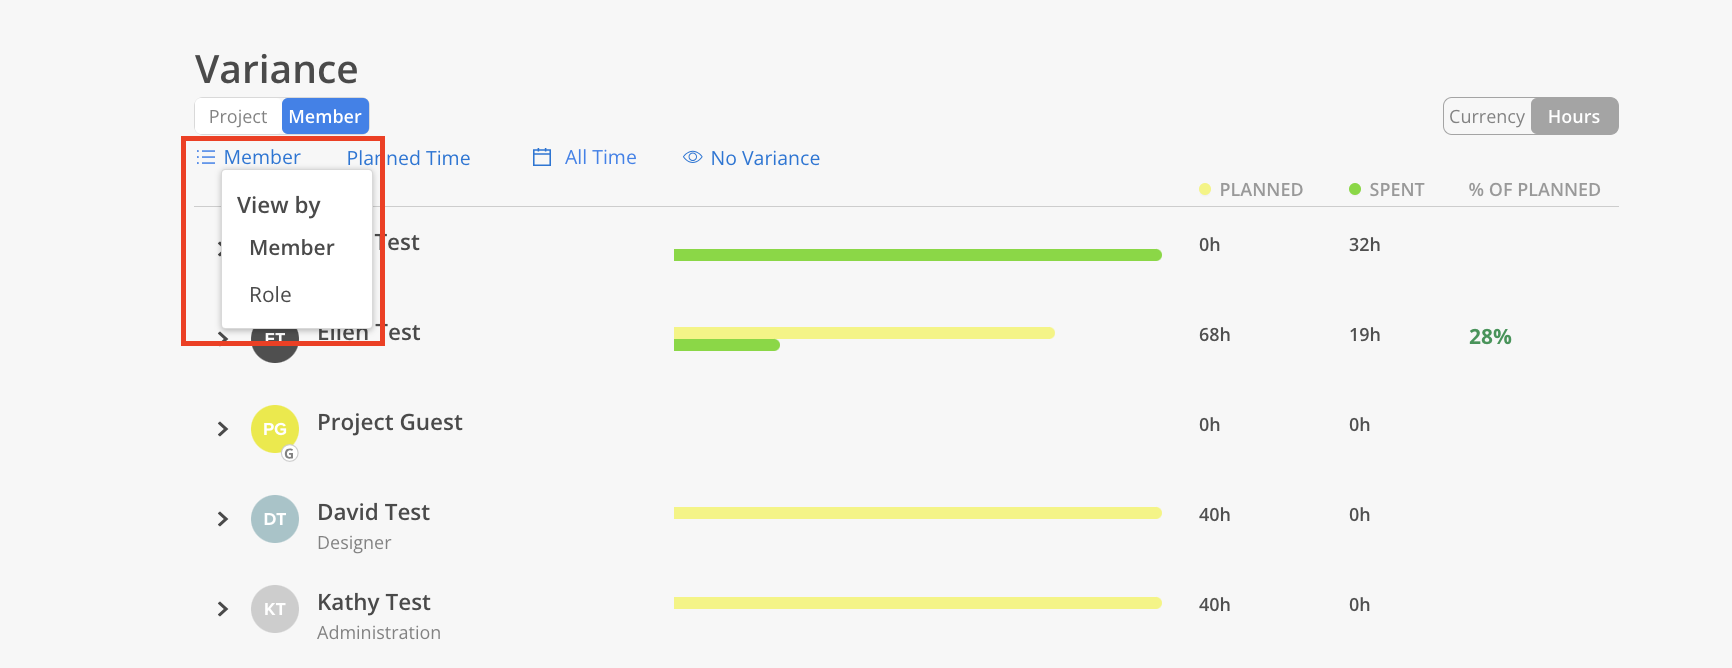
You can also view by roles on the Member view.
On the variance tab, the "Planned Time" and "Spent Time" values show data from past dates only. This is different from the "Planned Time" displayed in the "Time" tab, which only shows future planned hours.
To see all time periods, including future planned hours, you can use the "Custom" option.