The Time Variance Report allows you to look at a project's initial estimates or planned time vs. the actual time spent. The selected view options, Projects, Members, date range will be automatically saved in this report. All filters and selected Projects in this report are automatically saved for future use.
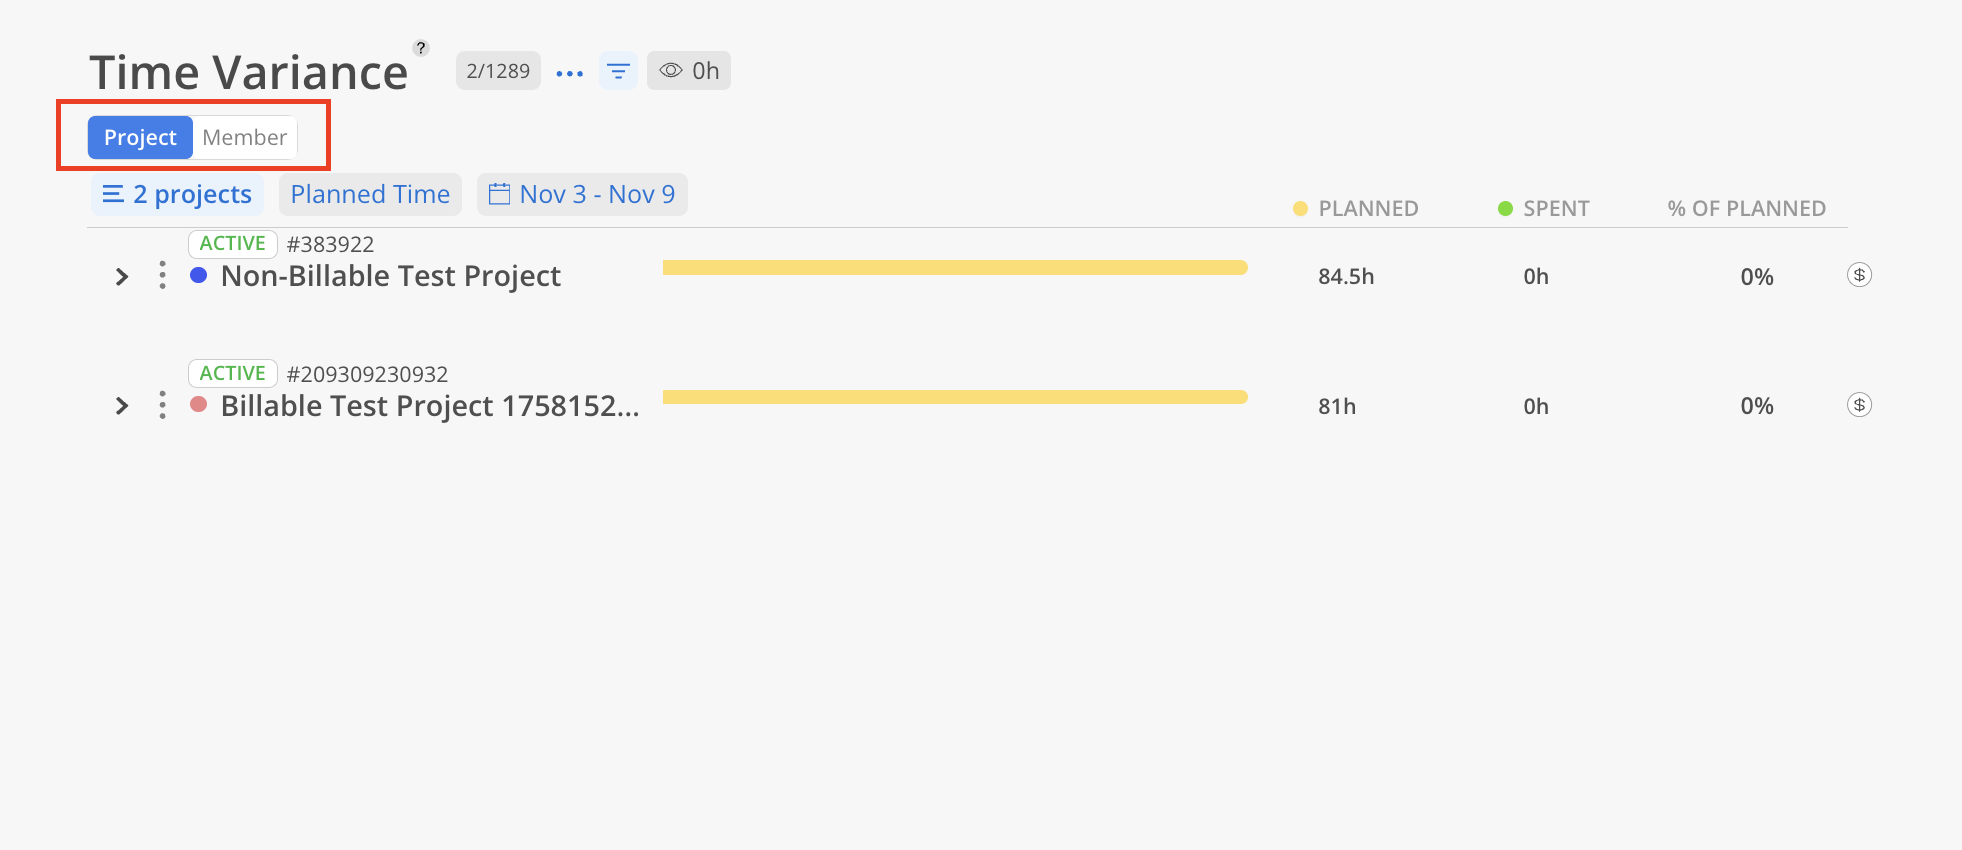
The report data can be grouped either by Projects or by Members.

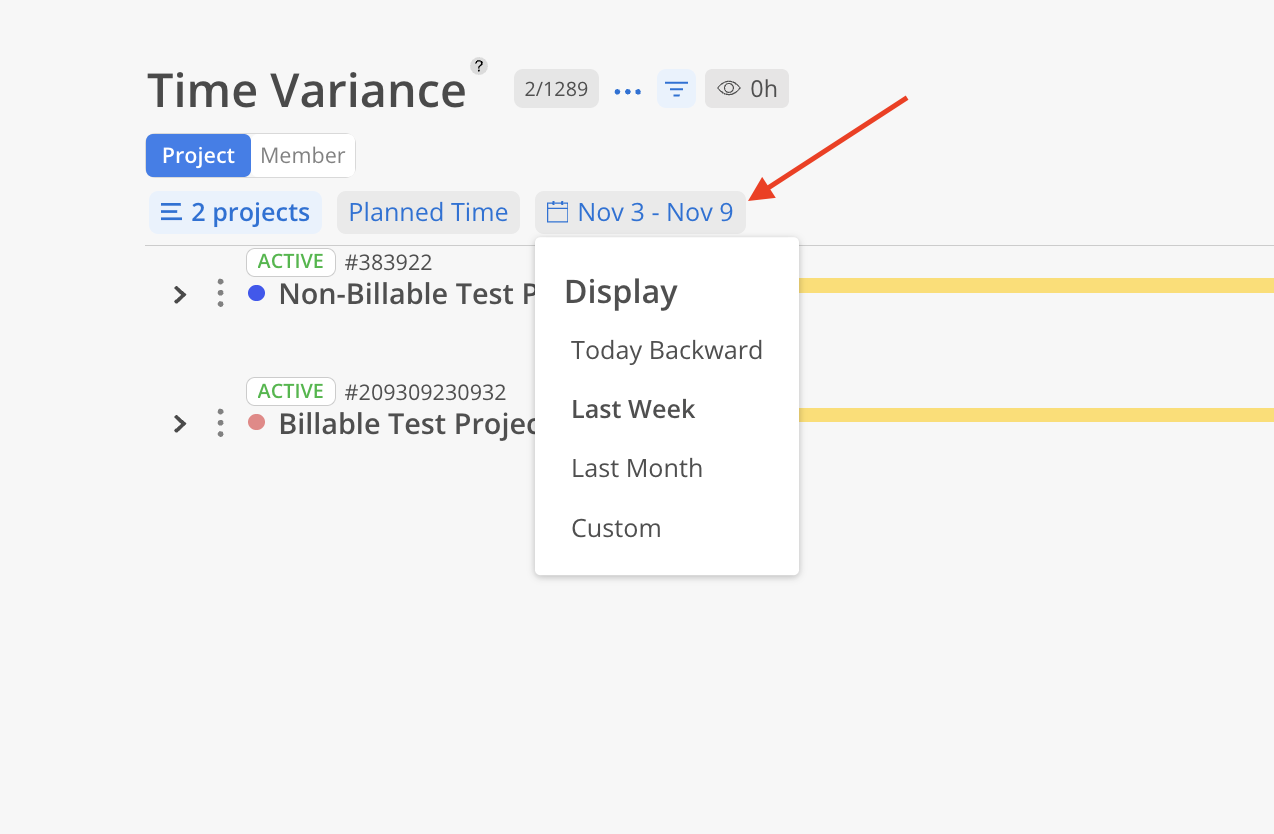
To see all time periods, including future planned hours, you can use the "Custom" option.
You can use this to view to see how you are tracking toward project goals or viewing completed projects to assist how you should plan/bid for similar projects.
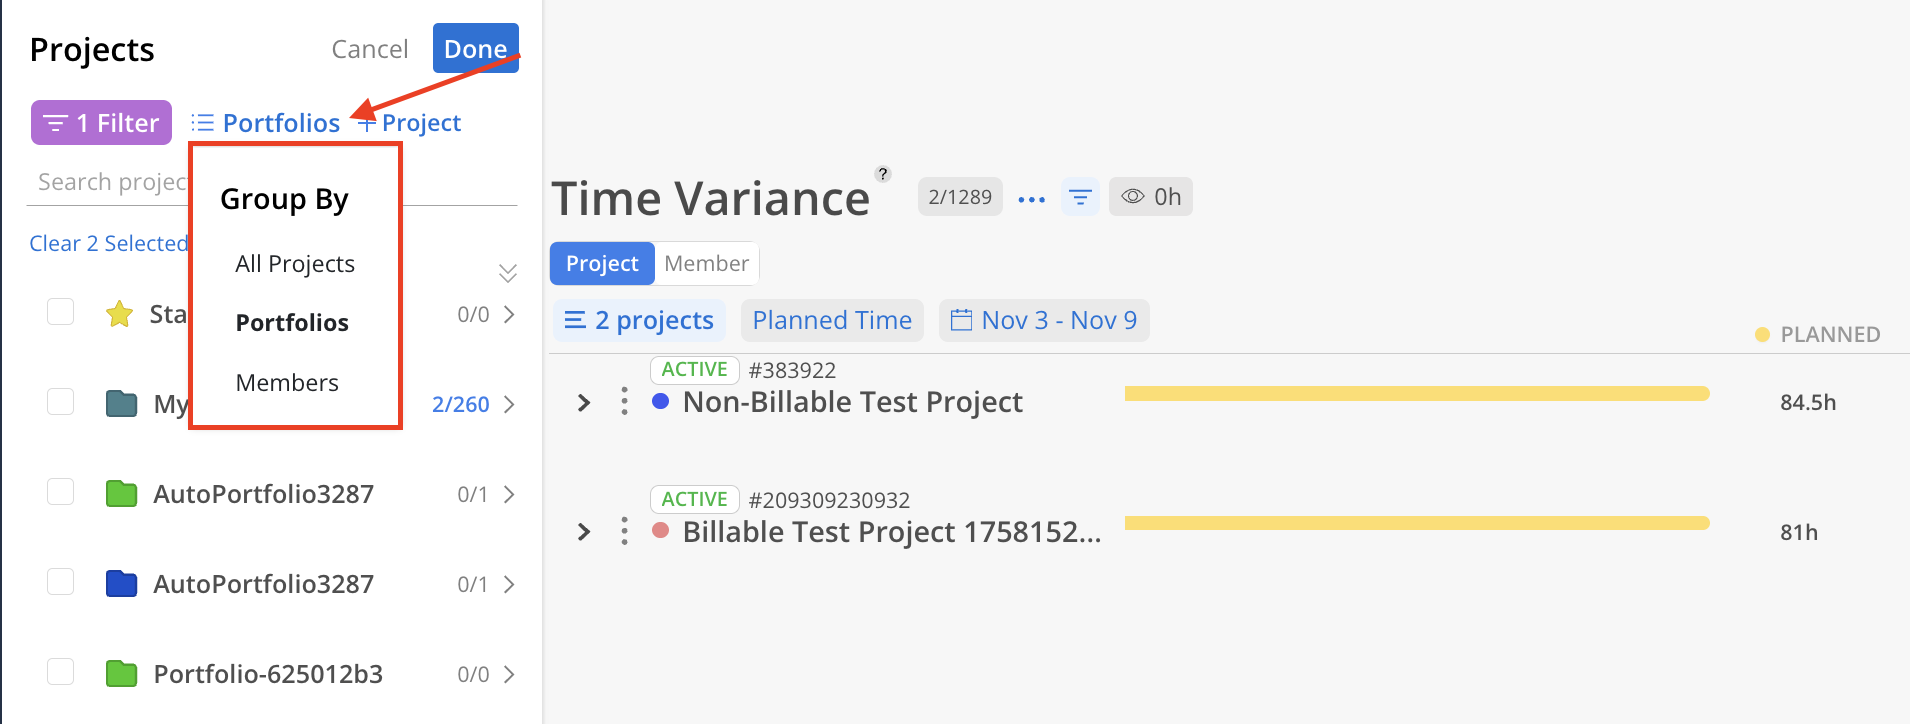
Select the project(s) you would like to view. Use the filter to narrow down the projects by clicking on the Filter button.
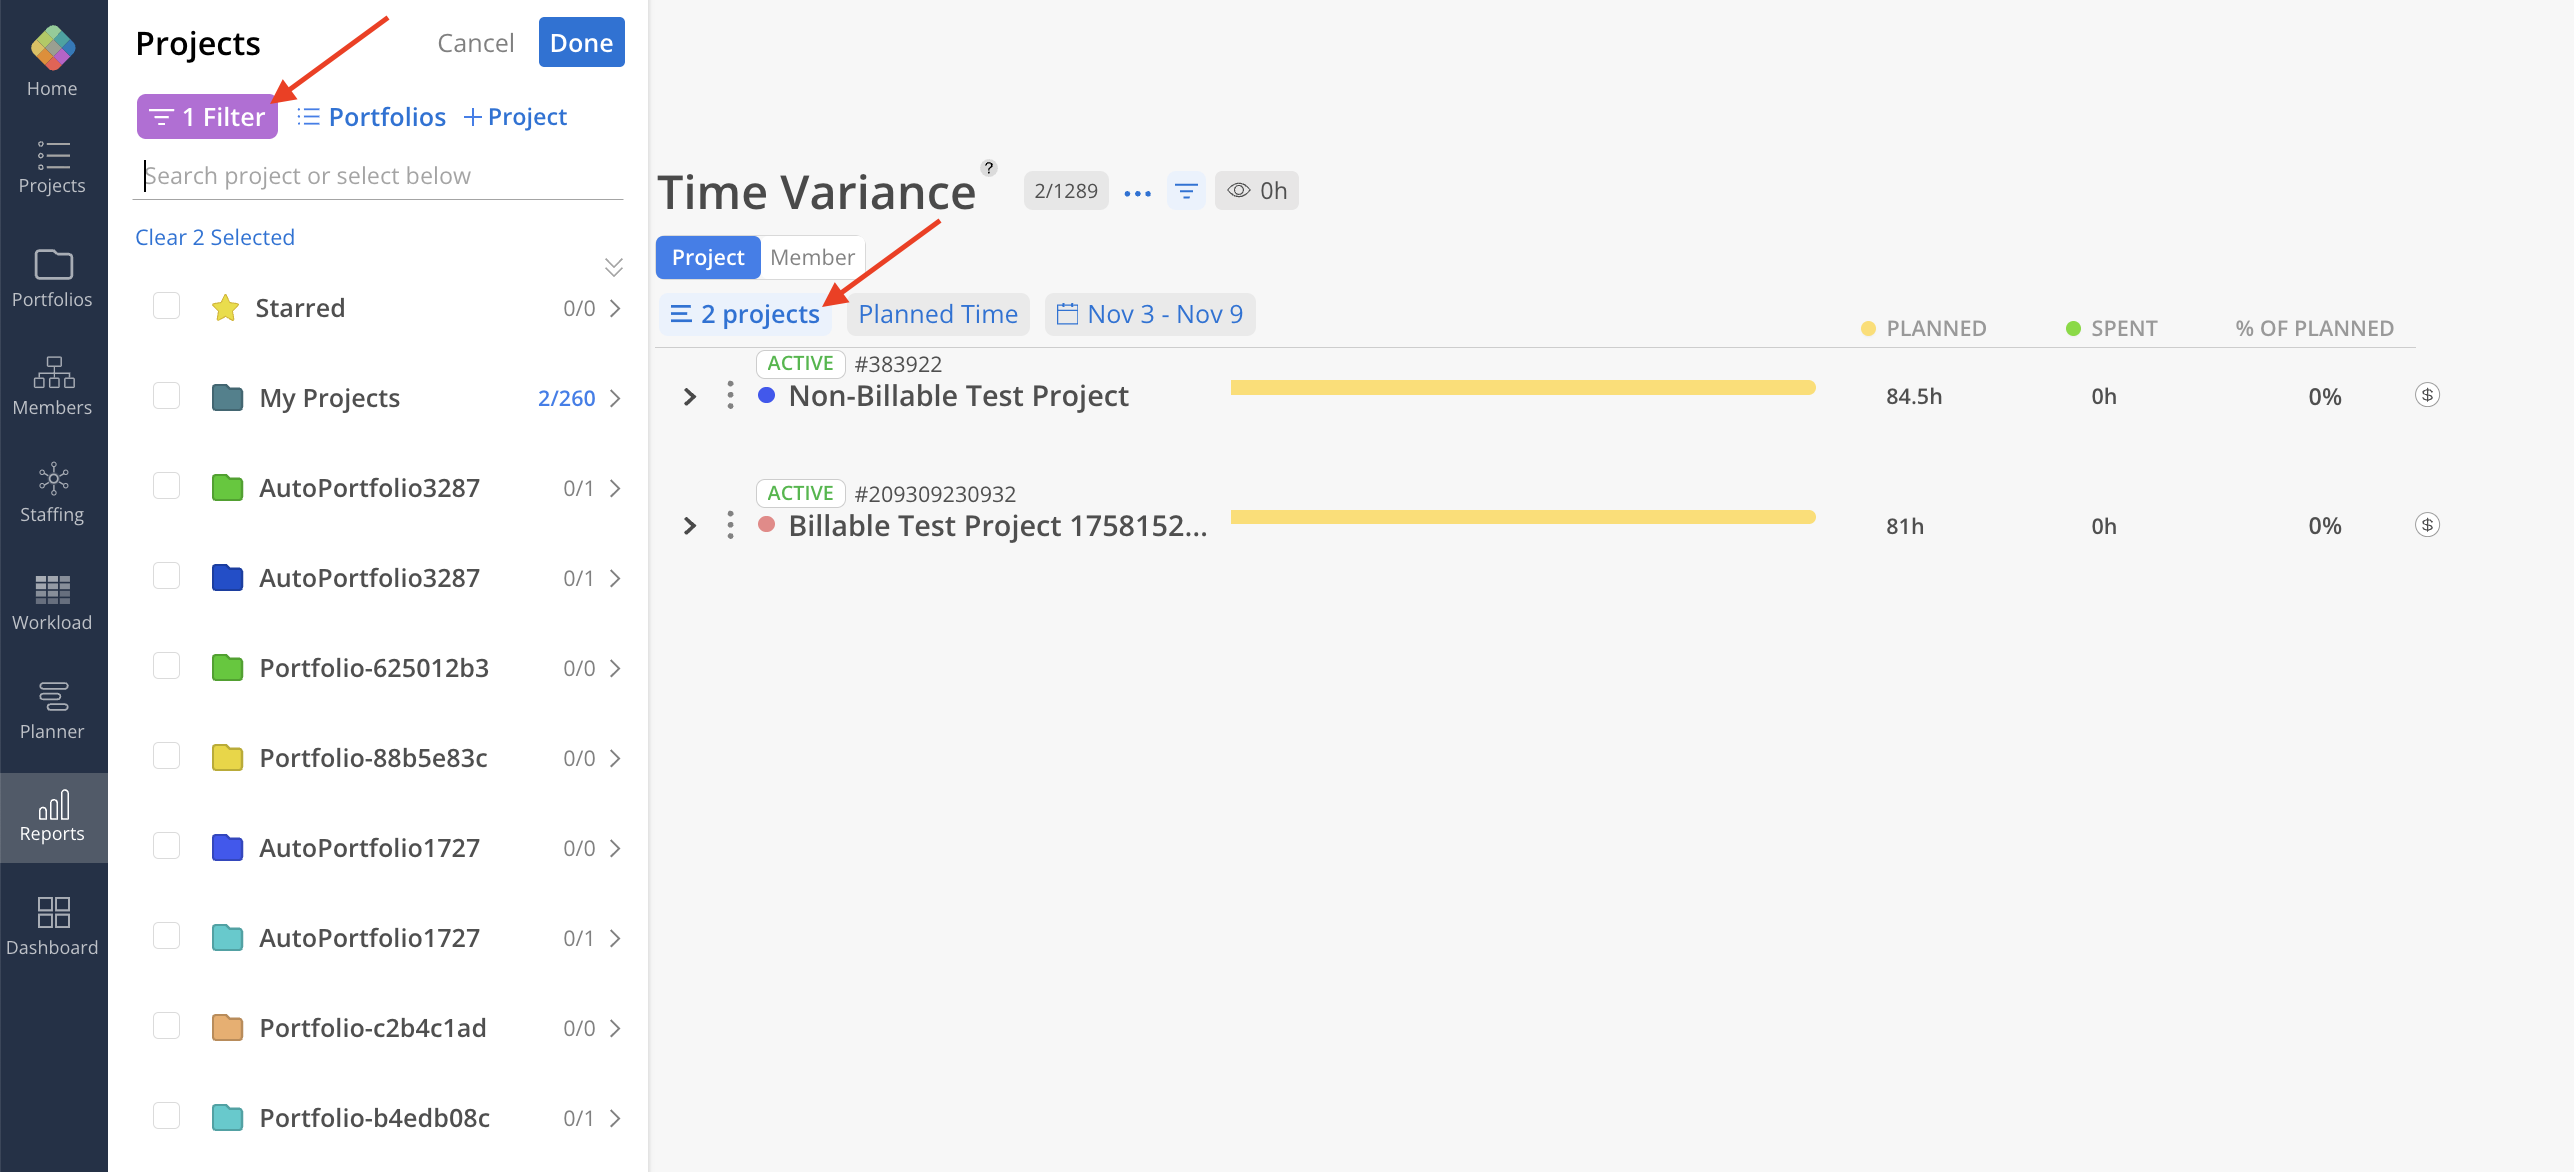
Use the Portfolios button to group projects by Portfolios, All Projects, or All Members.
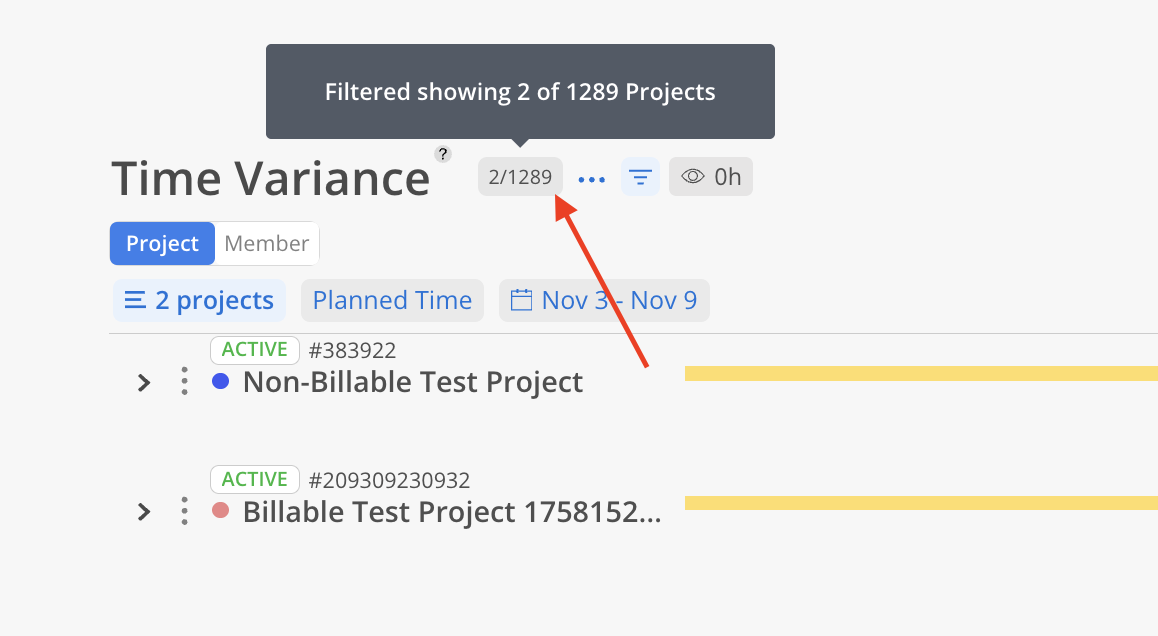
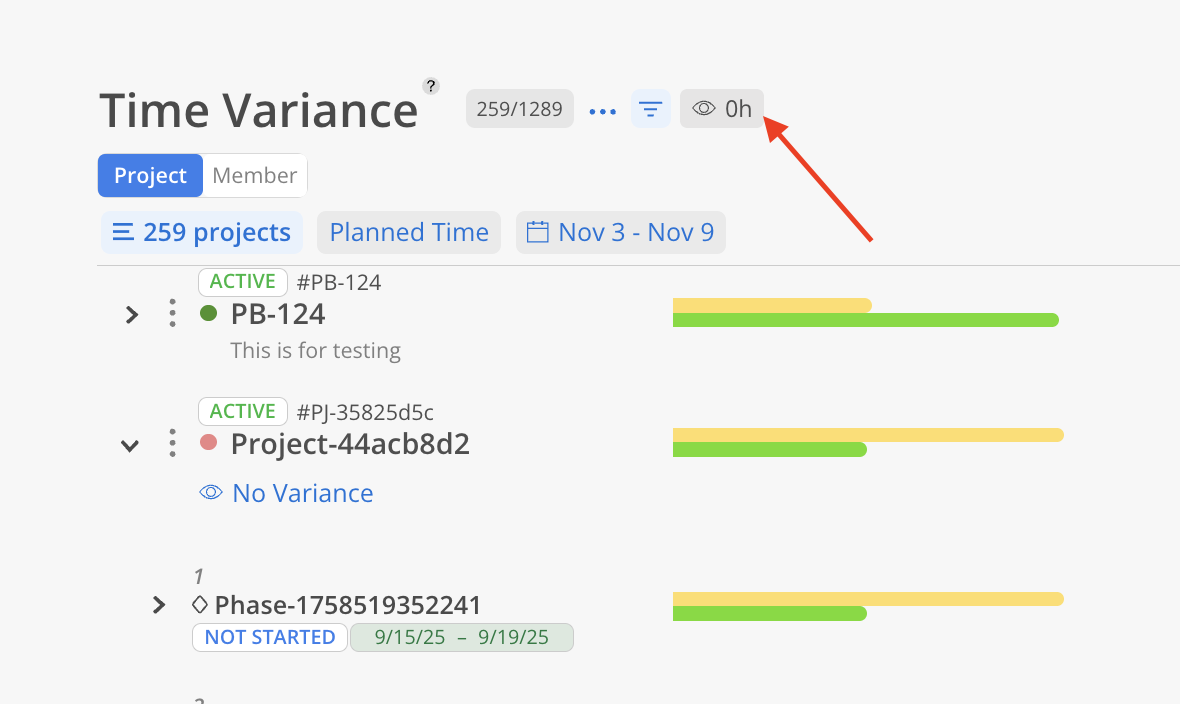
Next to the Report title, the number of filtered Projects is displayed alongside the total count.
Decide which variance you would like to view: "Spent Time vs. Planned" or "Spent Time vs. Member Budget”.
Spent vs. Planned Time
The Planned and Spent columns are displayed. The Planned column represents the total hours derived from Work Plans, while the Spent column reflects the total hours recorded in the timesheets.

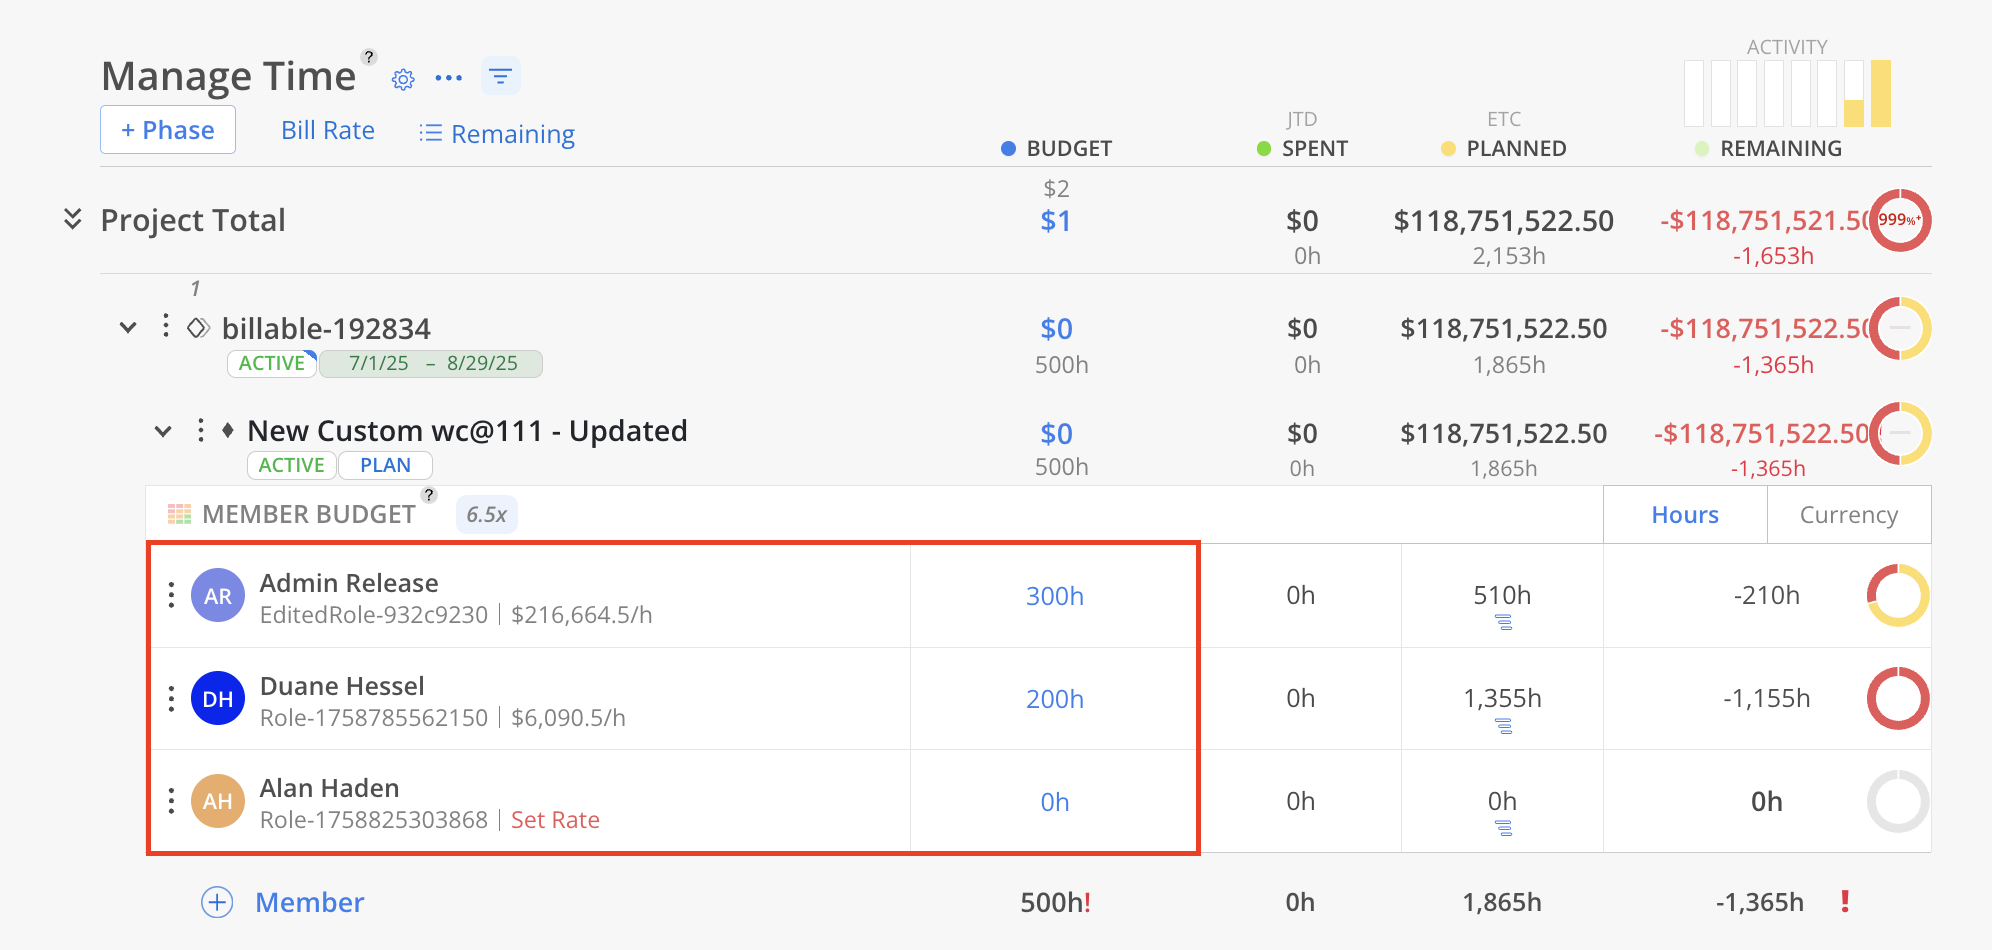
Spent vs. Member Budget
The Budget column indicates the estimated hours assigned to the member in the budget modal, while the Spent column displays the total hours logged in the timesheets. The aggregated estimated hours for members are displayed at the work category, phase, and project levels.

On the right hand side of project you will see a green or red percentage displaying the project's overall performance.
Red = overestimate (spent amount exceeds planned amount)
Green = underestimate (spent amount is below planned amount)

Expanding a project displays the variance for each individual phase. Further expansion of a phase provides details about its members and their specific contributions to the variance.
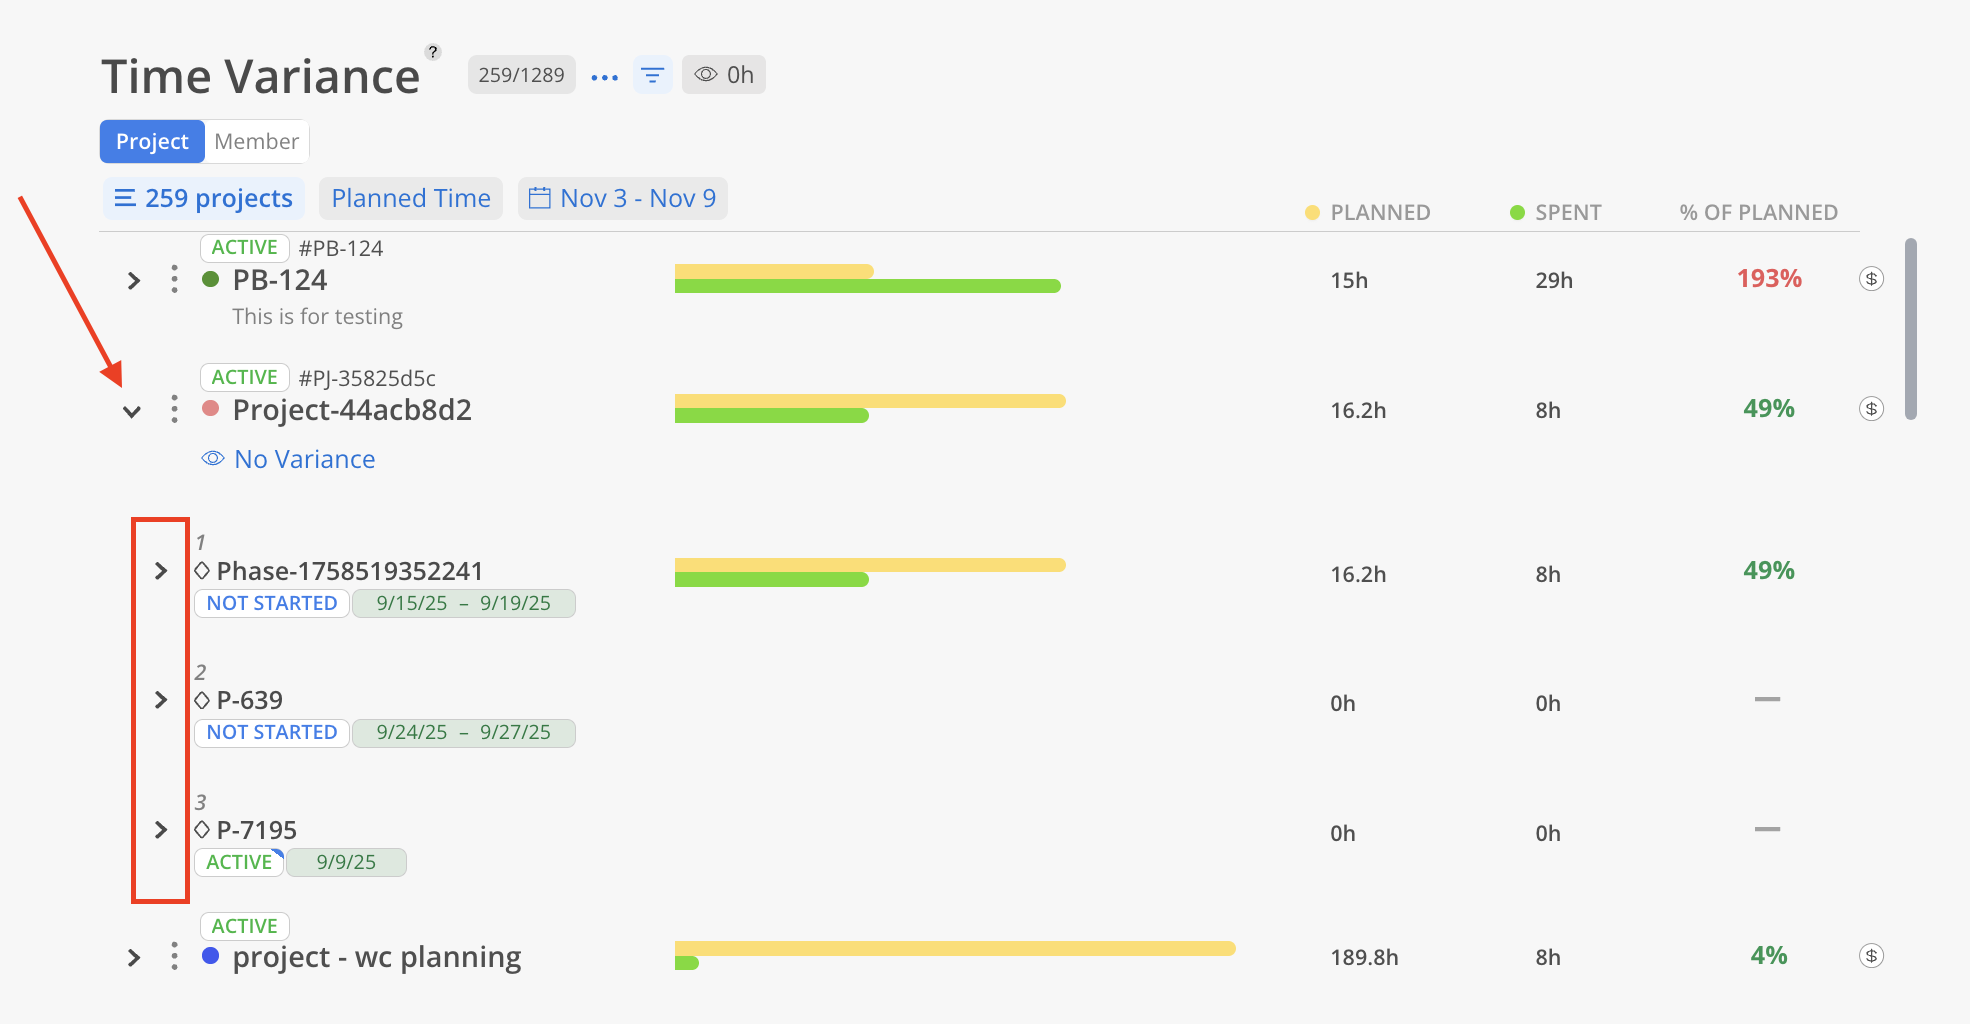
The No Variance button filters out projects or phases without variance, meaning those without planned/estimated hours or spent hours recorded.
Click on the three dots of a Project to:
Go To Project: Open the Project in a new tab
View Project Budget: Open Project Budget Space
Edit Project Info: Open Project Info Modal
Set Project Color: Change the color of the Project
Manage Members: Change Member Project permission, add or remove Members
Edit Phases: Edit Phases information and dates.

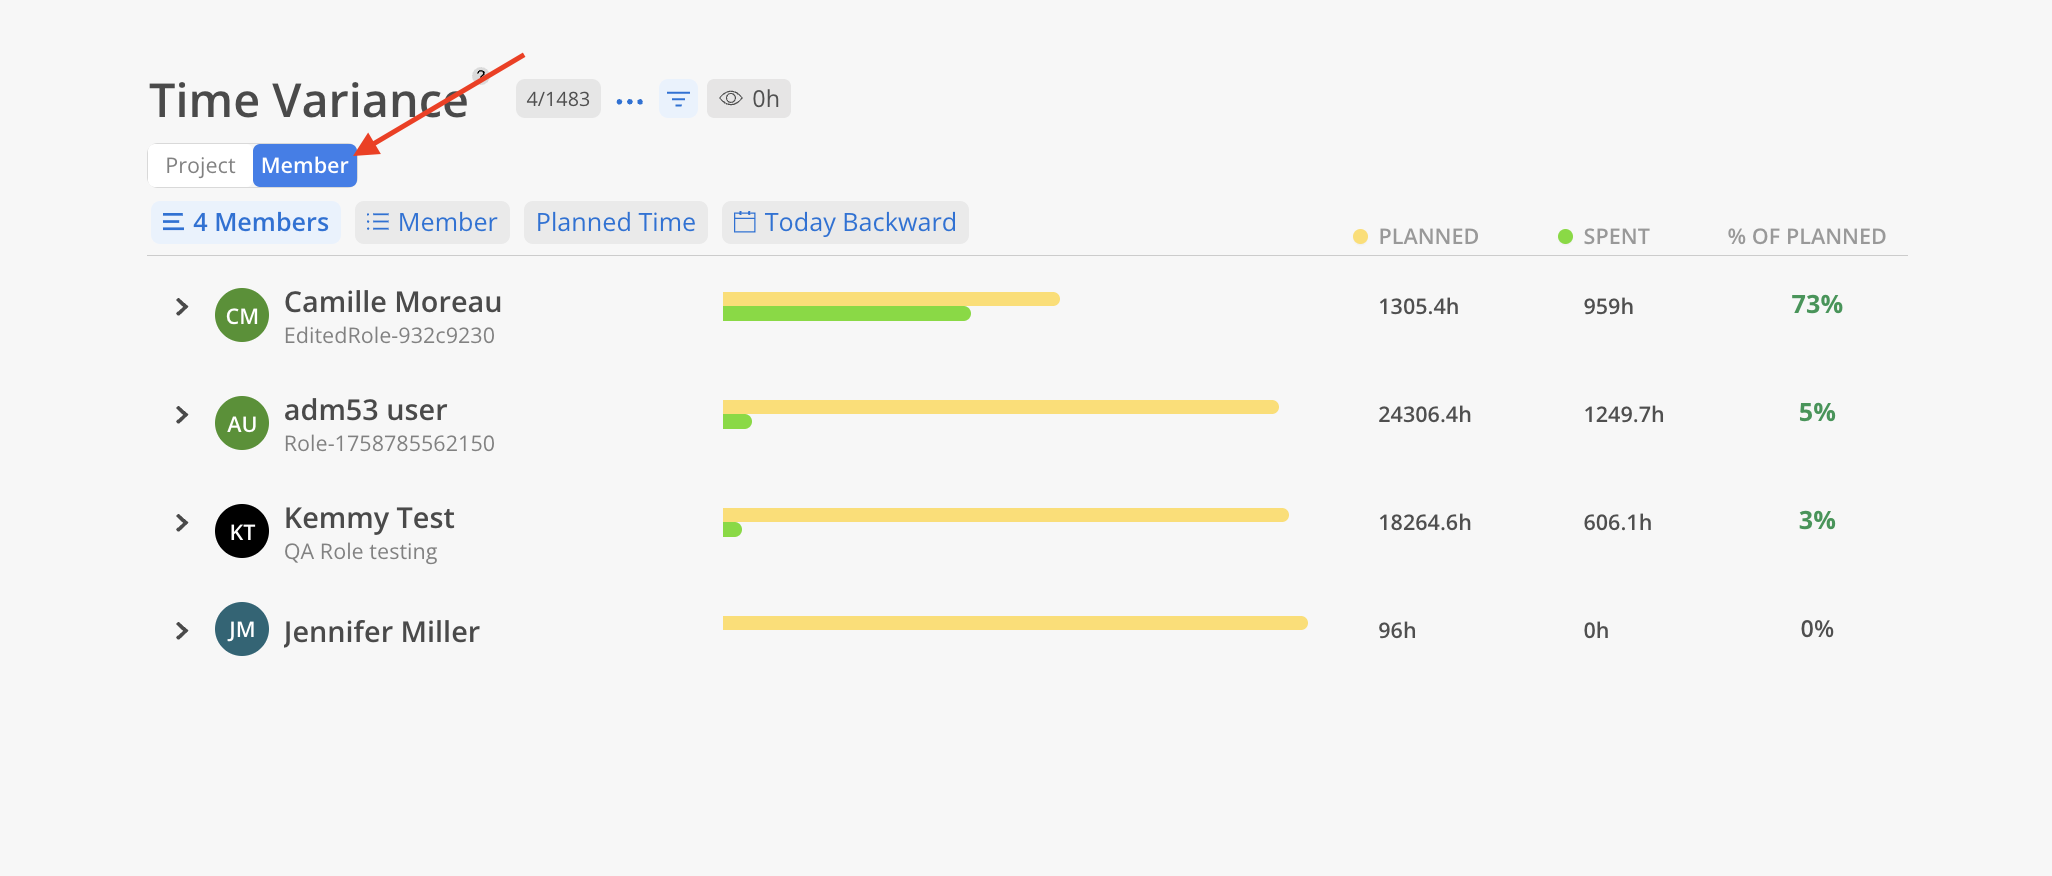
Allows you to look at one individual Member and view their overall contributions.
Click on the Member tab.
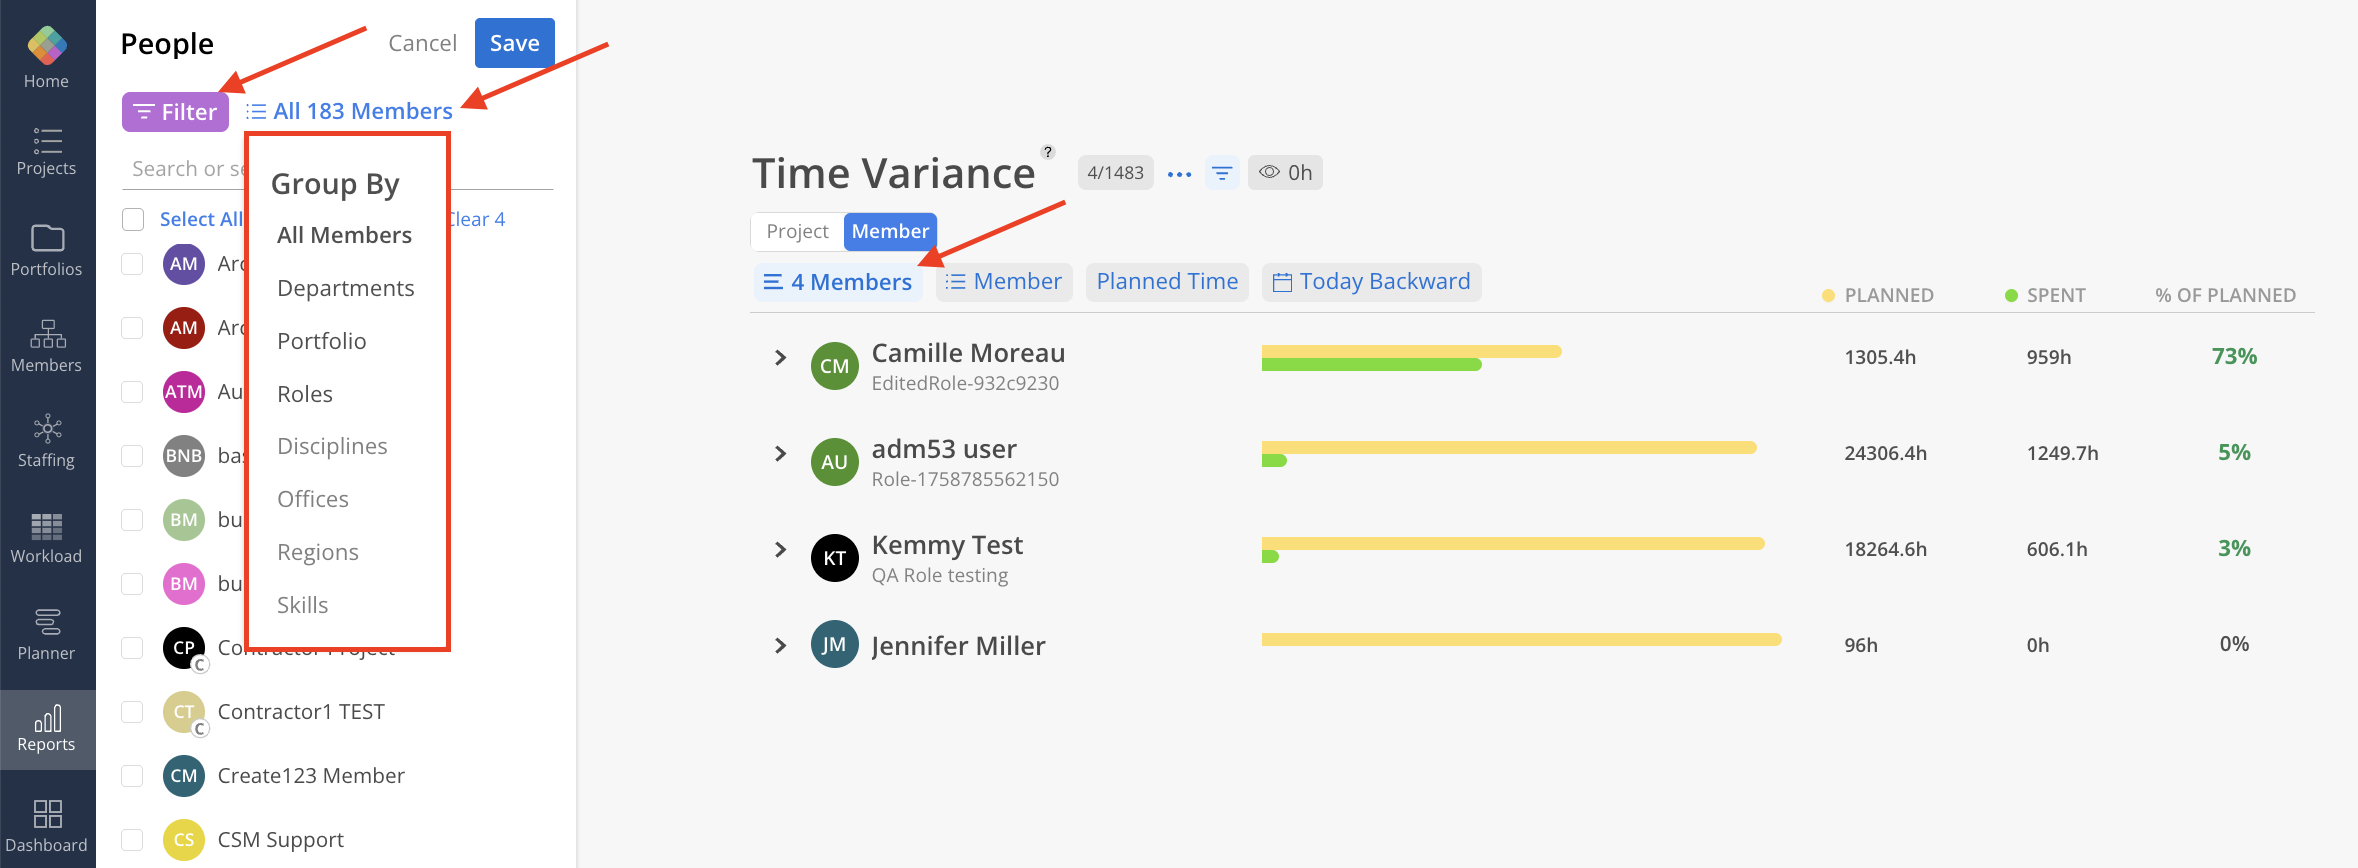
Select the members you would like to view.
Click All Members to group Members by Departments, Disciplines, Offices, Portfolios, Roles, Regions, and Skills.
You can filter your members list by clicking on the Filter button in the top left.
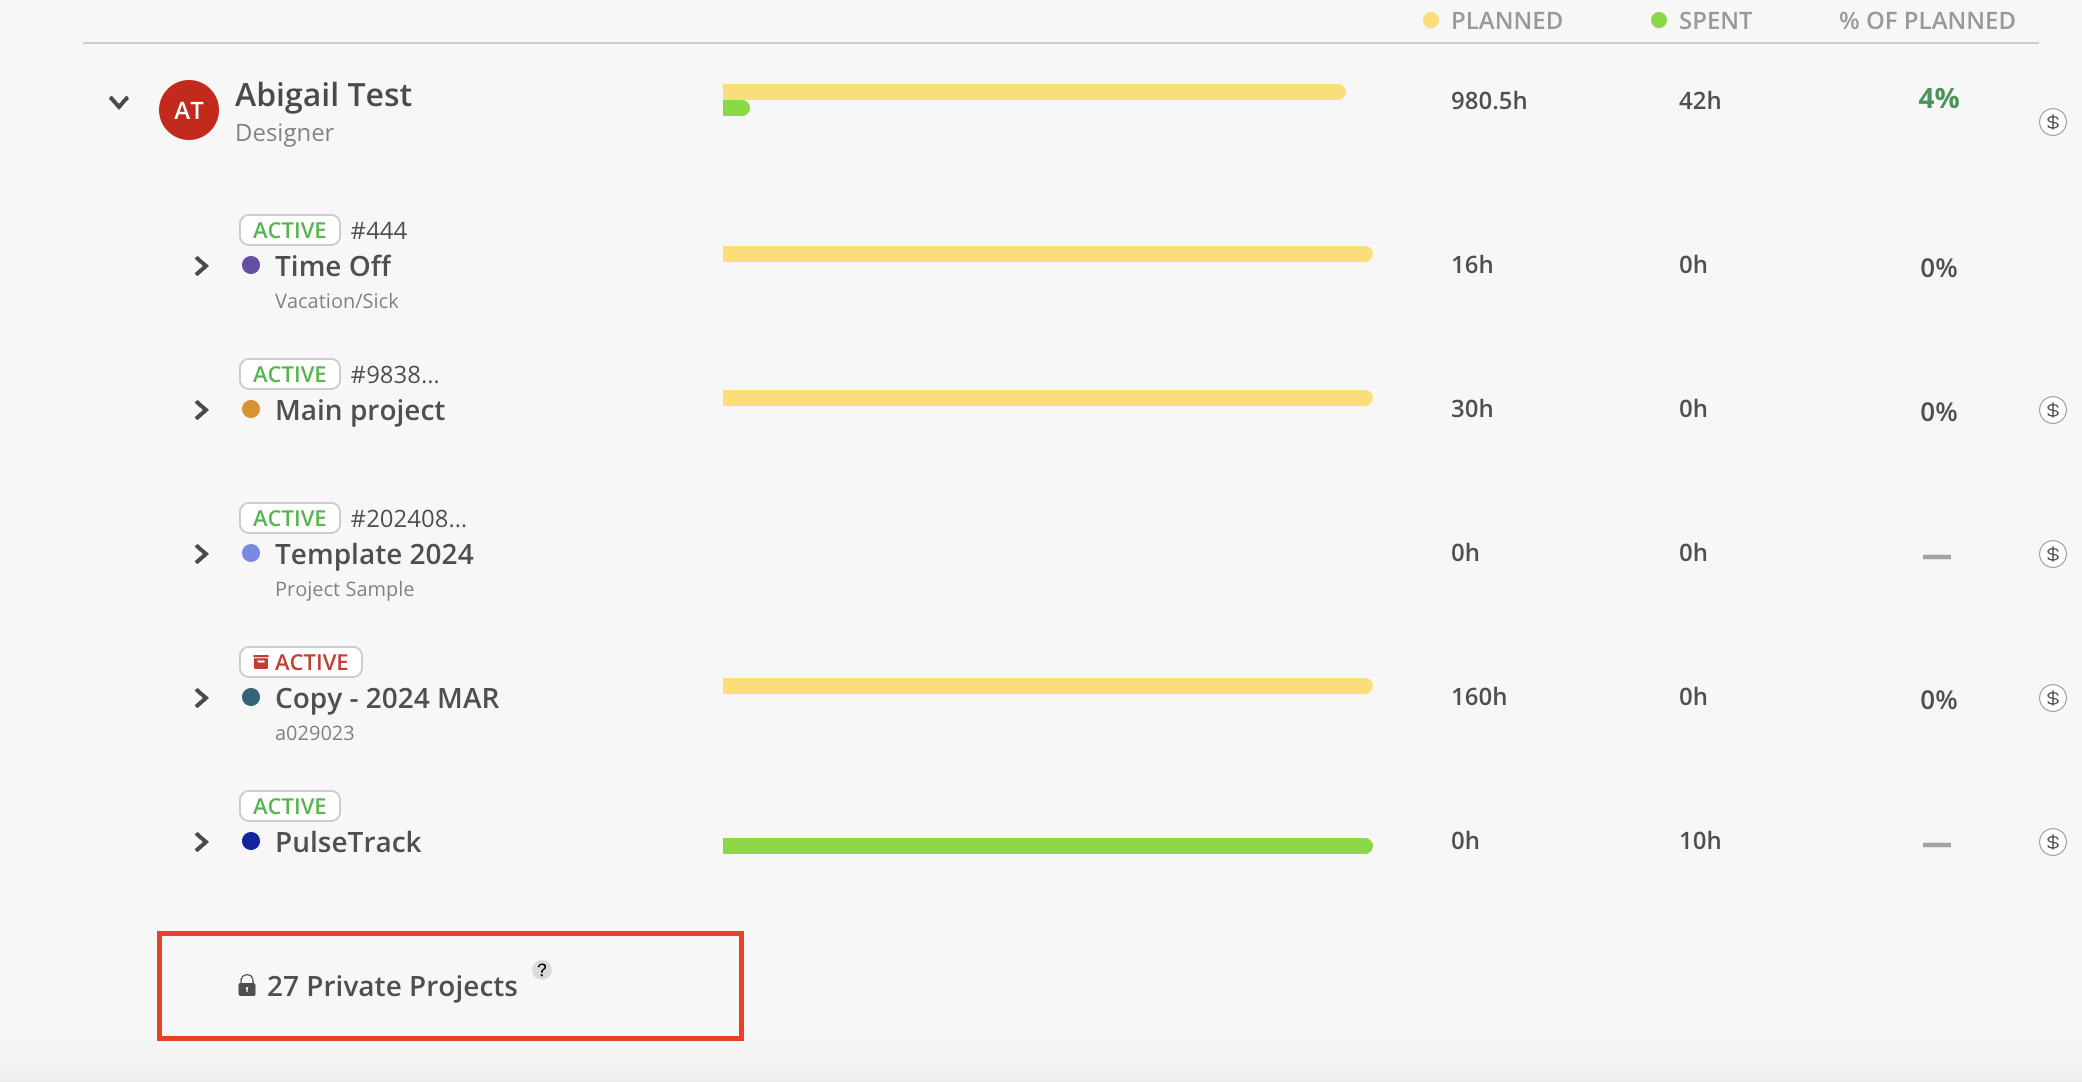
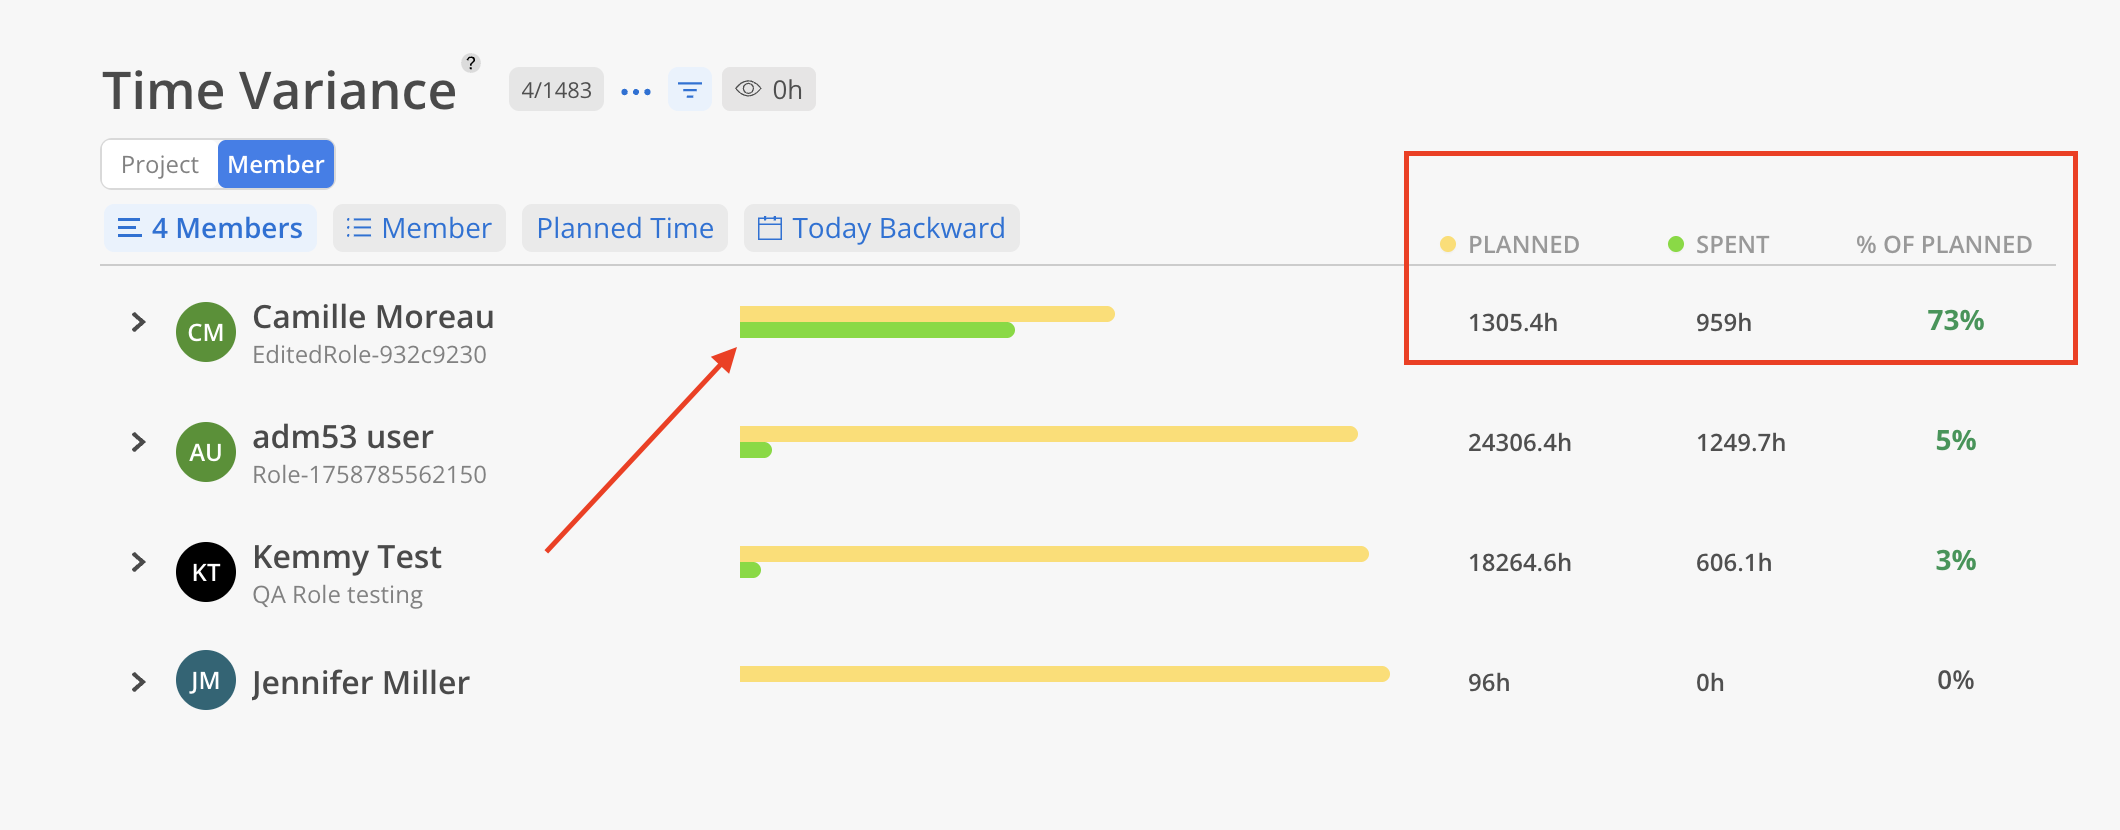
You will see two bars next to each member's name. Also, on the right-hand side of each member row, a green or red percentage is displayed.
Yellow bar = planned hours
Green bar = spent across all projects
Green percentage = underestimate (spent amount is below planned amount)
Red percentage = overestimate (spent amount exceeds planned amount)
Dash is displayed if no planned and spent hours.
Expand the Member to see how the Member's variance breaks down by Project and by Phases, Subphases and Work Categories.

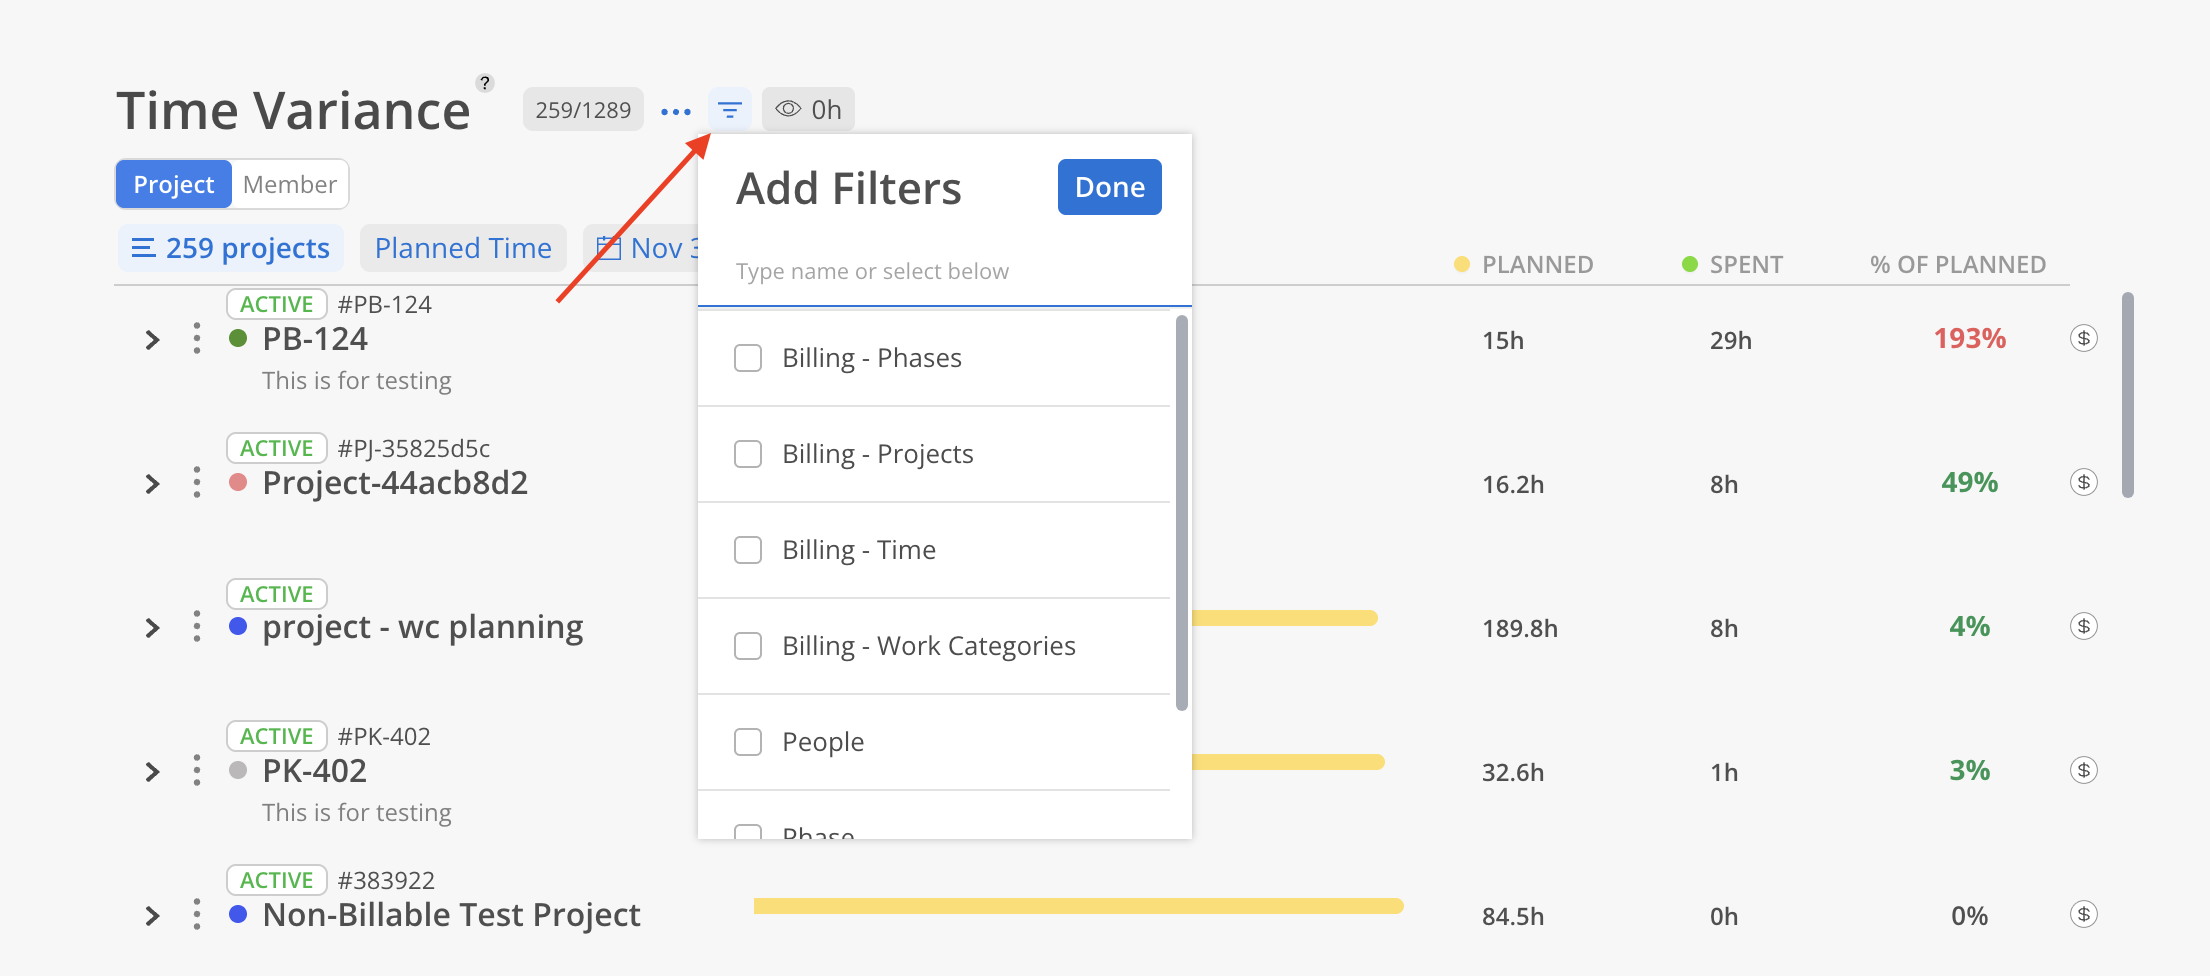
Click the filter icon at the top of the Report to adjust the displayed results based on various criteria, which may differ depending on the active tab.
Work Planners with the following permissions:
Work Planner > Can Edit > Projects they are a Member of
Work Planner > Can Edit > Projects they are a Project Manager of
can only view Projects they have access to (either as a Member or as a Project Manager).
Projects without access permissions will appear as "Private Project" and will not display a bar.