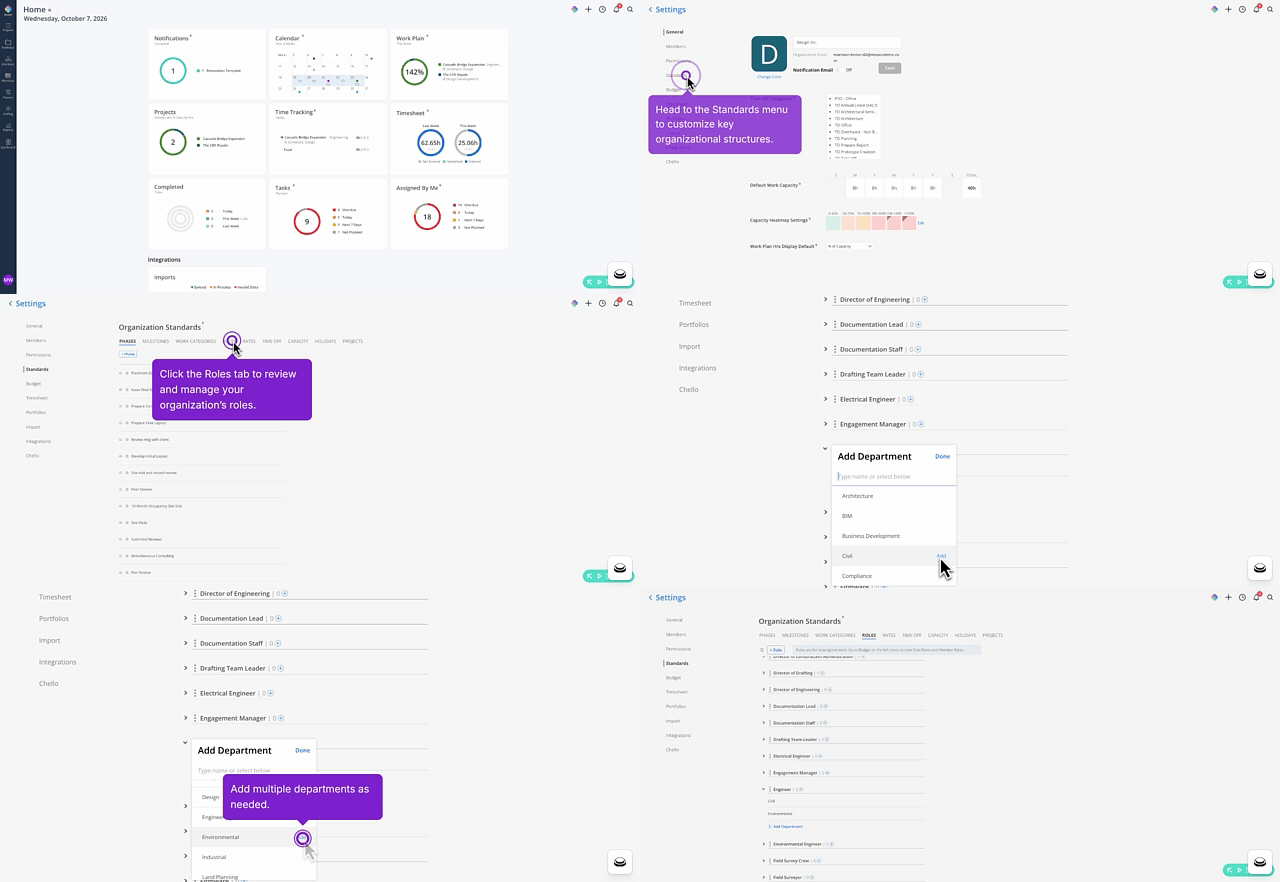
🔹 Tag Roles with Departments
Every role in your organization can now carry one or more departments, so an Engineer can live under Civil, Environmental, or both. Open roles inherit that tag, giving you department-based grouping and reporting on staffing needs across Planner and your reports. Start with the roles you staff most and expand from there as it's useful.
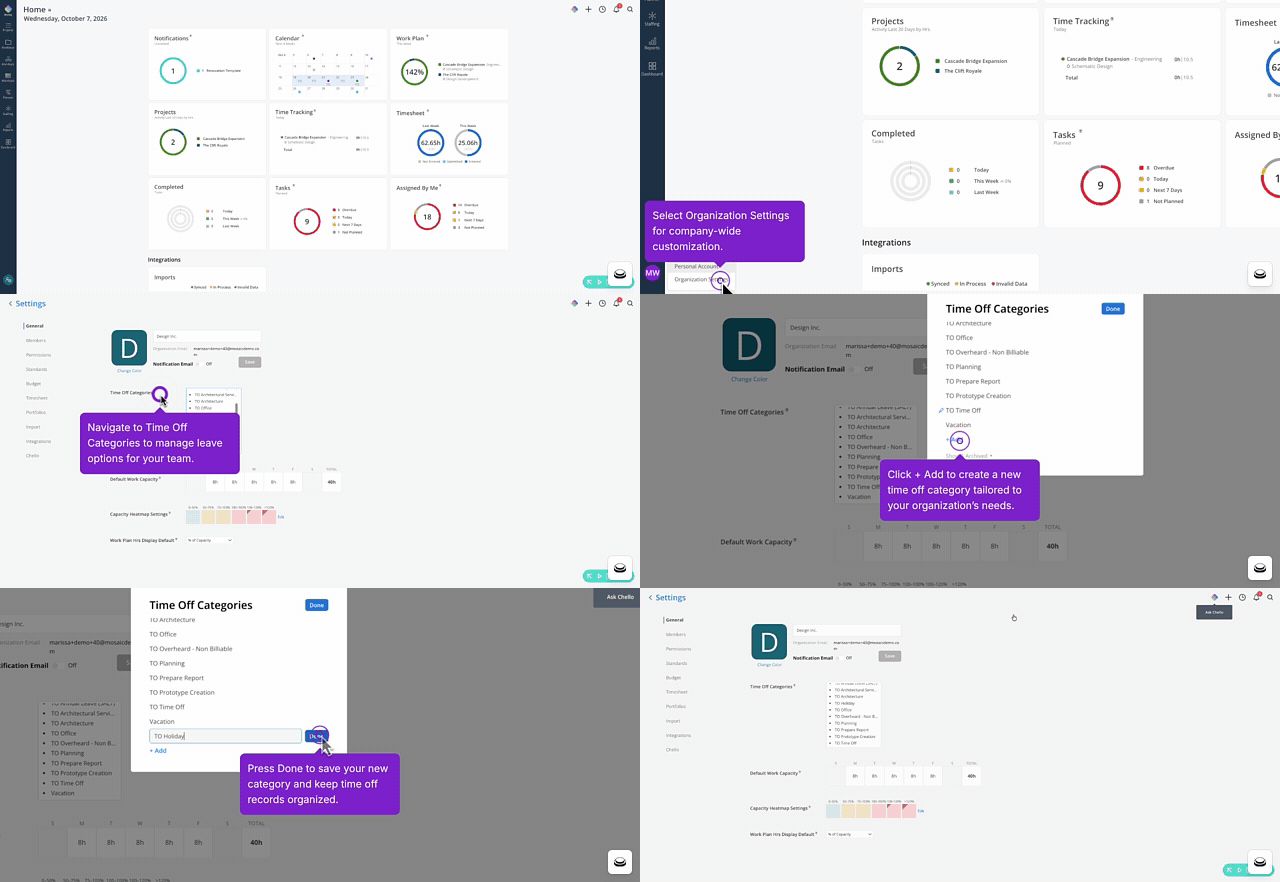
🔹 Build Your Own Time Off Categories
Set up the time off categories your team actually uses, like Vacation, Sick, or Jury Duty, right from Settings. Everyone picks straight from that list whenever they log or schedule time off, and every entry saves as non-billable automatically. Your existing time off history carries over the moment you turn categories on, so nothing needs to be re-entered.
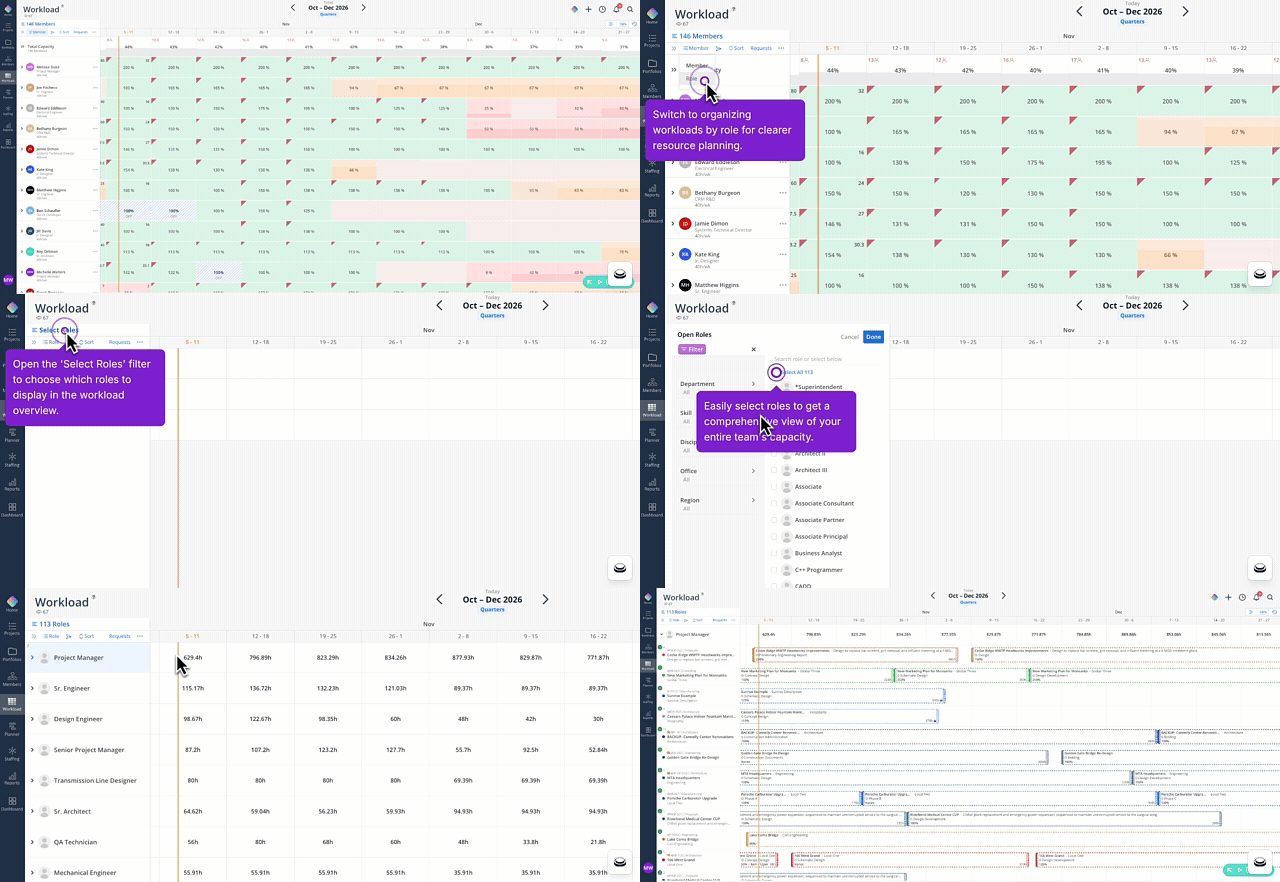
🔹 See Open Roles Right in Workload Space
Open roles now appear in the Workload heat map alongside your team, with the same planned-hours view. Expand a role’s row to see which projects drive its hours and spot staffing gaps before anyone is assigned. Add roles the same way you add team members, so one view tracks capacity across current staff and open positions.
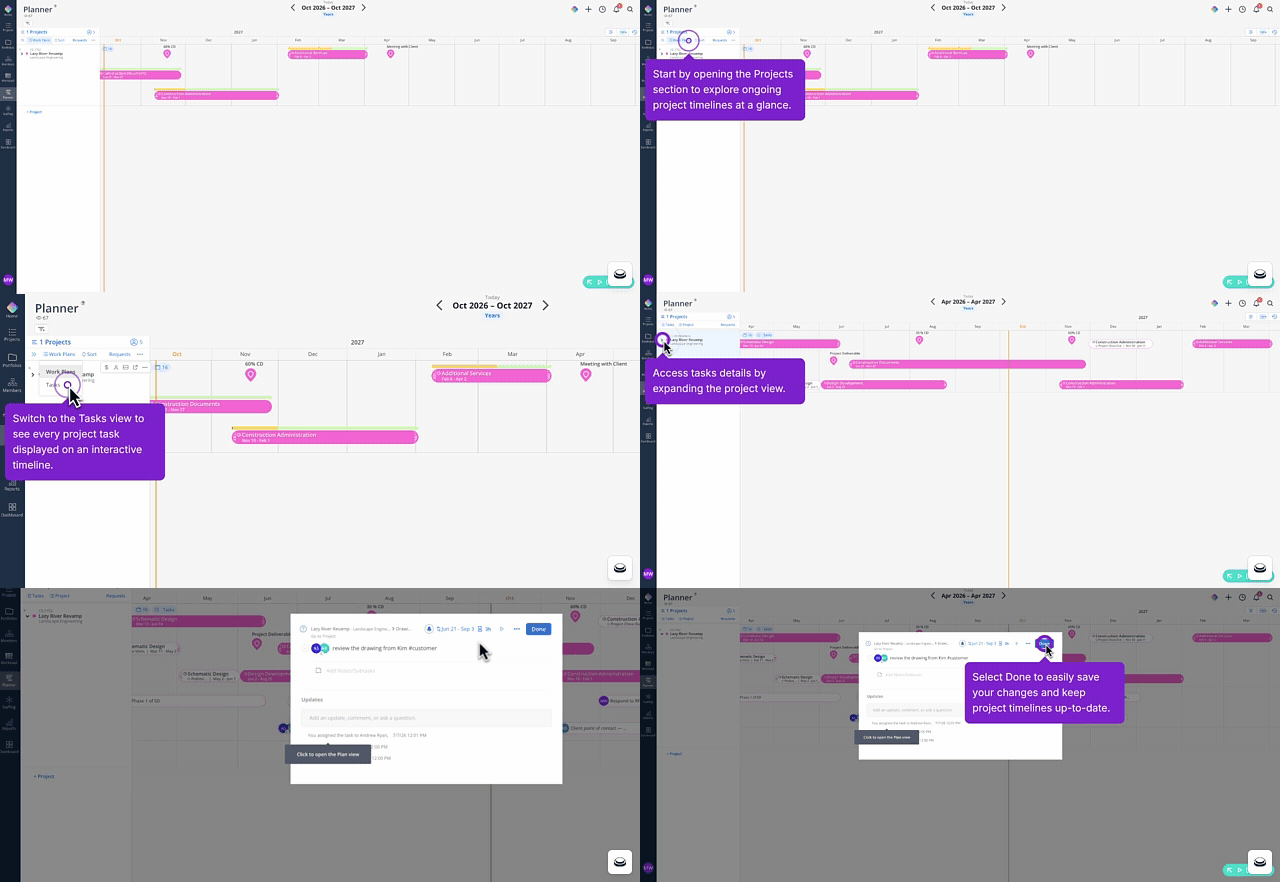
🔹 Switch Between Work Plans and Tasks in the Planner Space
Toggle between your Work Plans and Tasks without leaving the project you're staffing in Planner. Flip over to Tasks to check deliverables against the same timeline you're already using to plan capacity.
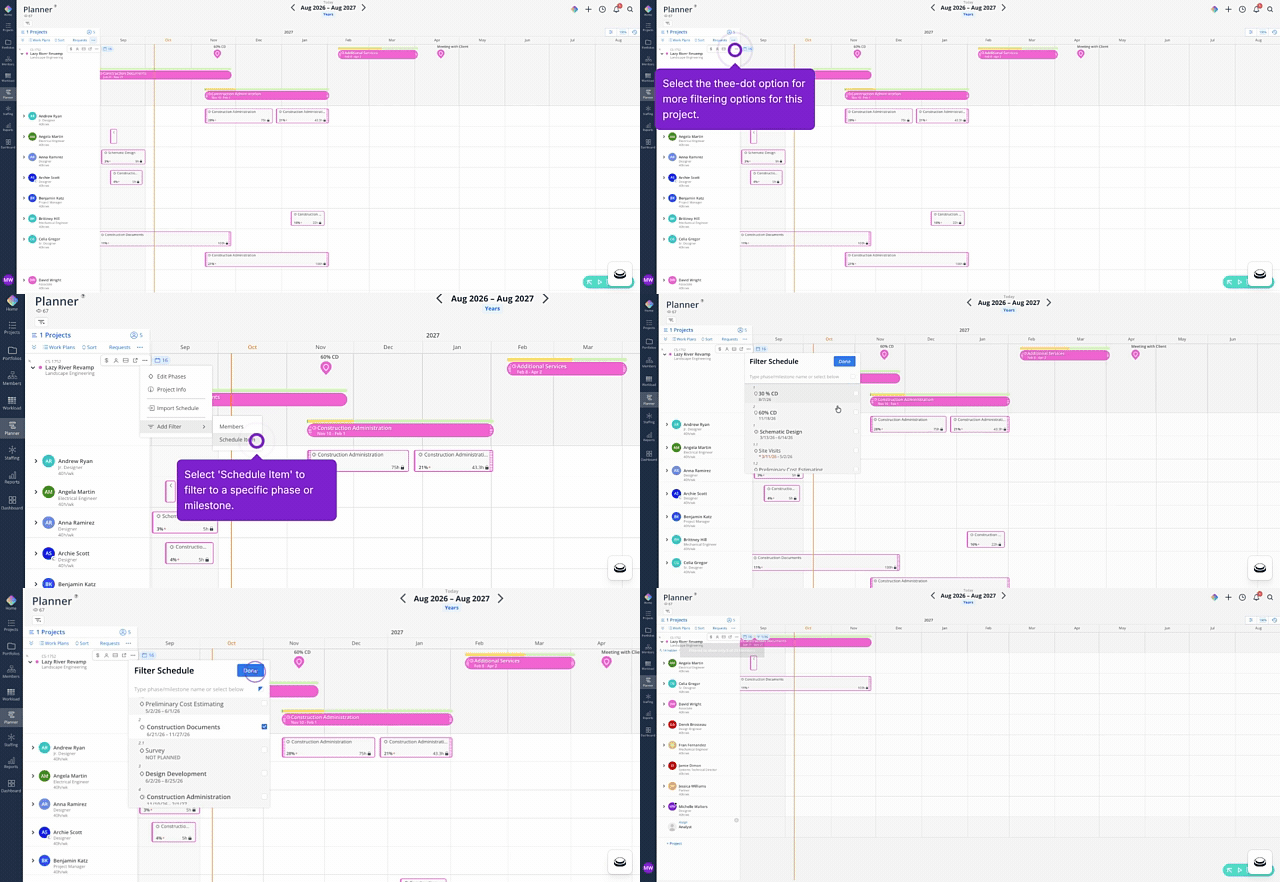
🔹 Planner now lets you condense your Phase and Milestone view
Filter a project's Planner row down to just the phases and milestones you want to see. The row shows what's hidden, your availability numbers match the filter you've set, and your selection is saved per project, so it's still set the next time you open it.
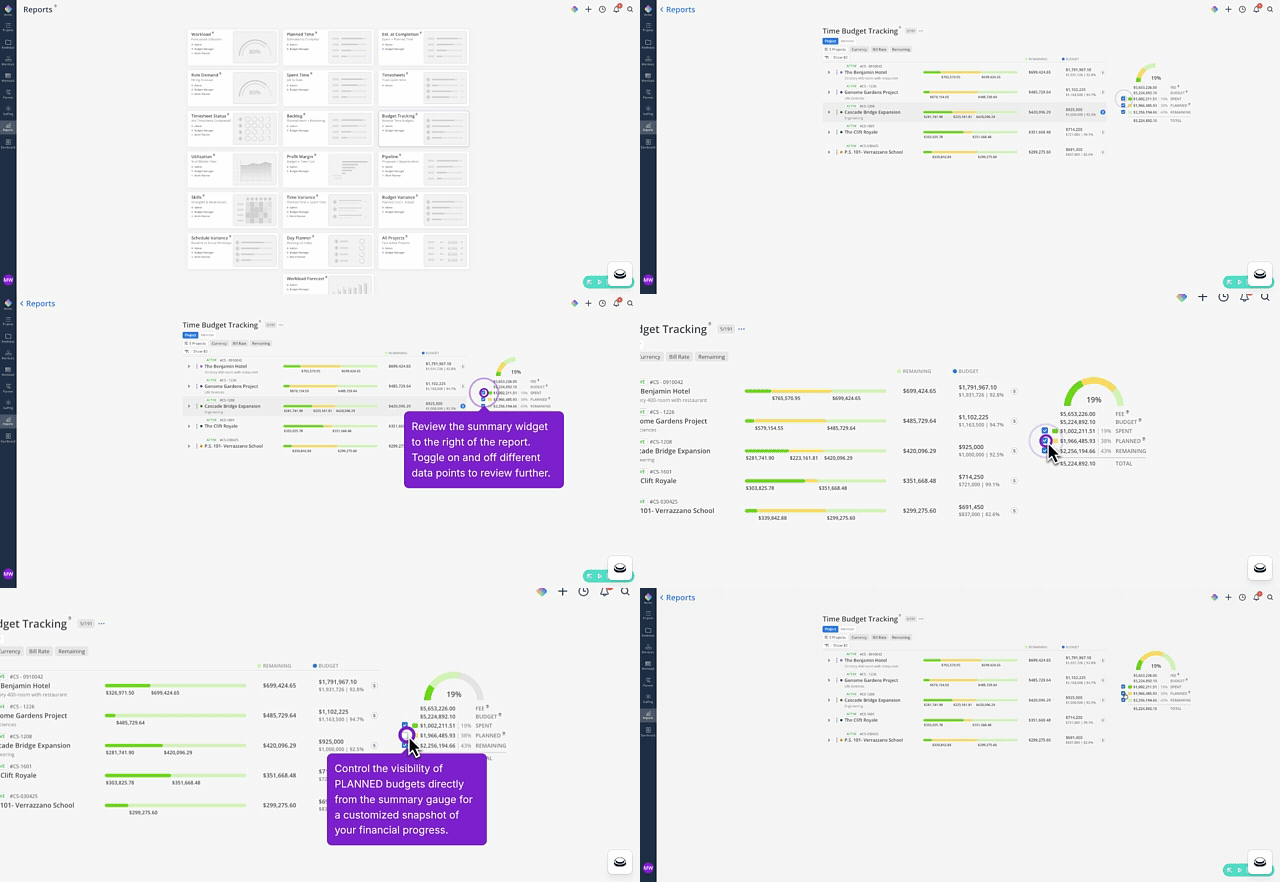
🔹 Summary Widgets Across Every Report
Every report now carries a summary widget alongside its chart and list, so the headline numbers sit right there before you scroll into the detail. Choose which data types show in that summary, giving each report the exact view your team checks most.