
It helps you understand where your project is heading based on current plans, not just where it stands today.
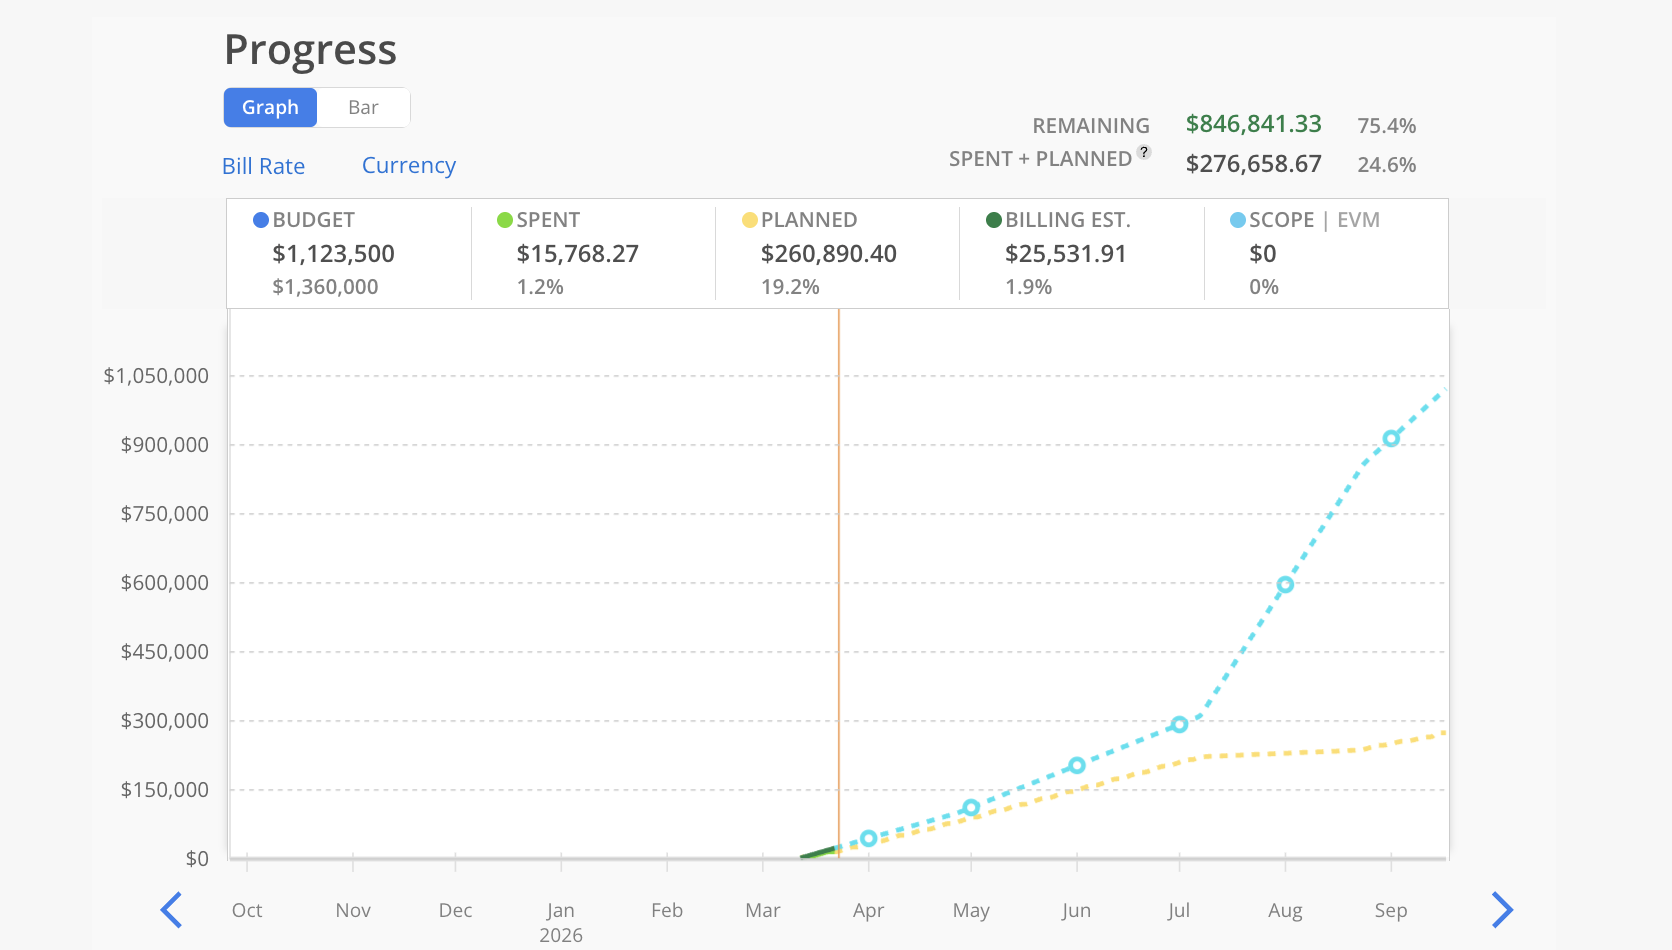
This is the best place to go when you want to:
Forecast when a project will reach its budget
Identify if current plans will cause overruns
Understand how work is distributed over time
Understanding the chart
The Progress view includes:
Budget line → total project budget
Spent time → light green line, work completed to date
Planned time → yellow line, future scheduled work
Timeline → dark green line, project duration
How to use Progress
Forecast budget consumption
Look at where your total spend + planned work intersects the budget line.
This shows:
When the project is expected to reach its budget
Identify early risk
If planned work exceeds the budget line:
The project is trending over budget
Adjust plans in the Time tab
Understand pacing
Switch to bar view to:
Compare work month-to-month
Identify uneven distribution
[Add image: Bar chart view showing monthly spend vs plan]
Best practices
Review Progress regularly
Use it to make proactive adjustments
Don’t wait until later phases to evaluate risk