The Dashboards space enables the creation of mini report views that can be shared with team members.

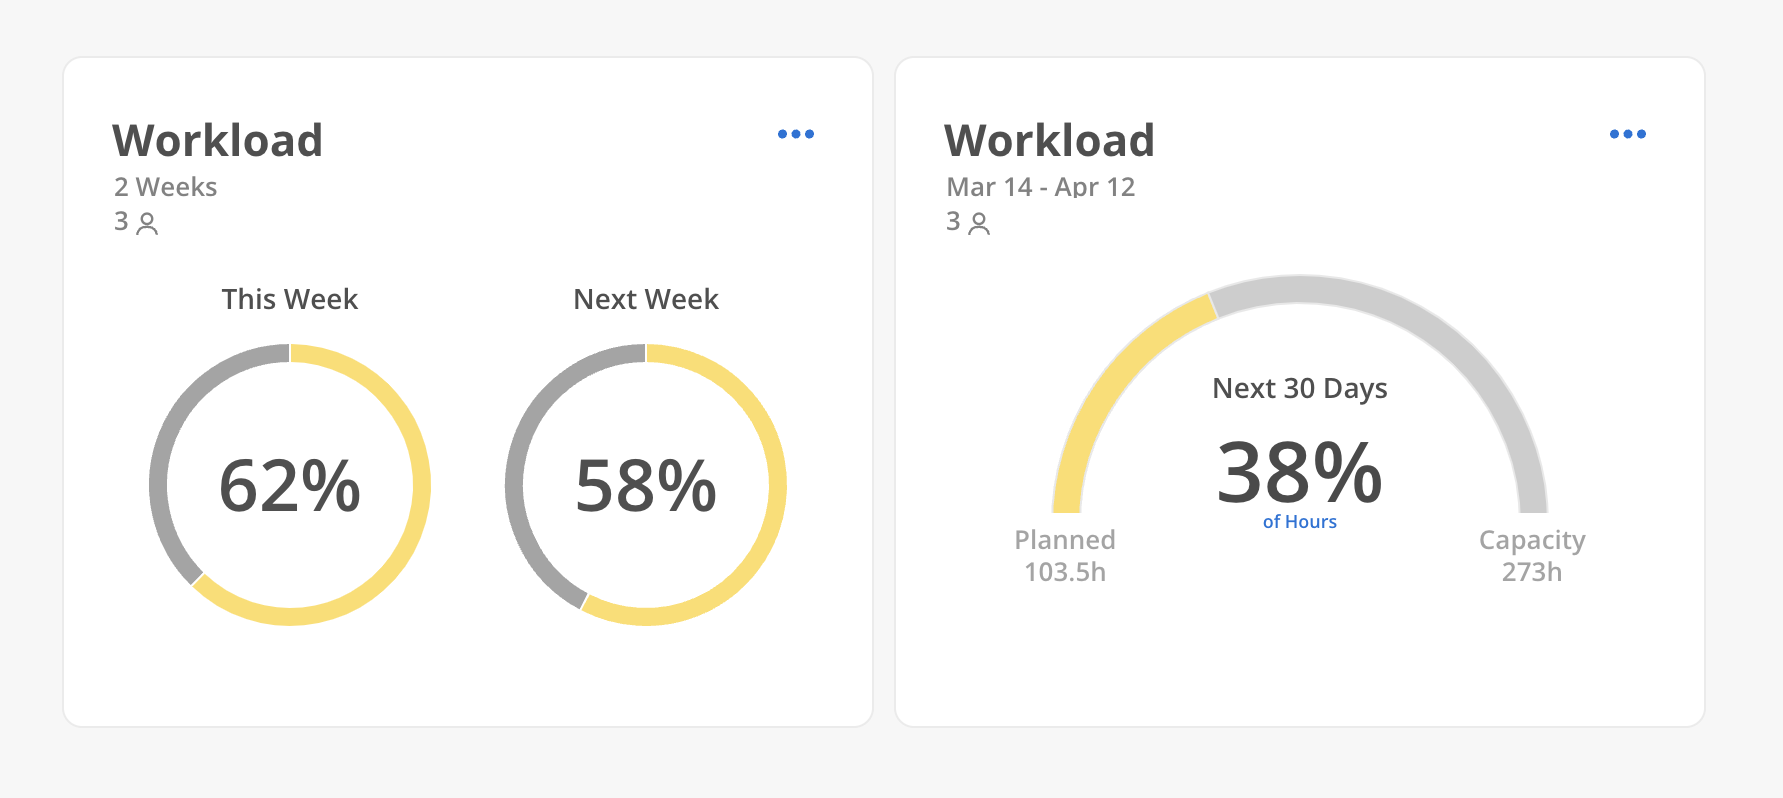
Workload Next 2 Weeks: Displays a summary of the workload for the selected Member for the current and upcoming week.
Workload Summary: Provides a summary of the workload for the selected Member over a specified date range.
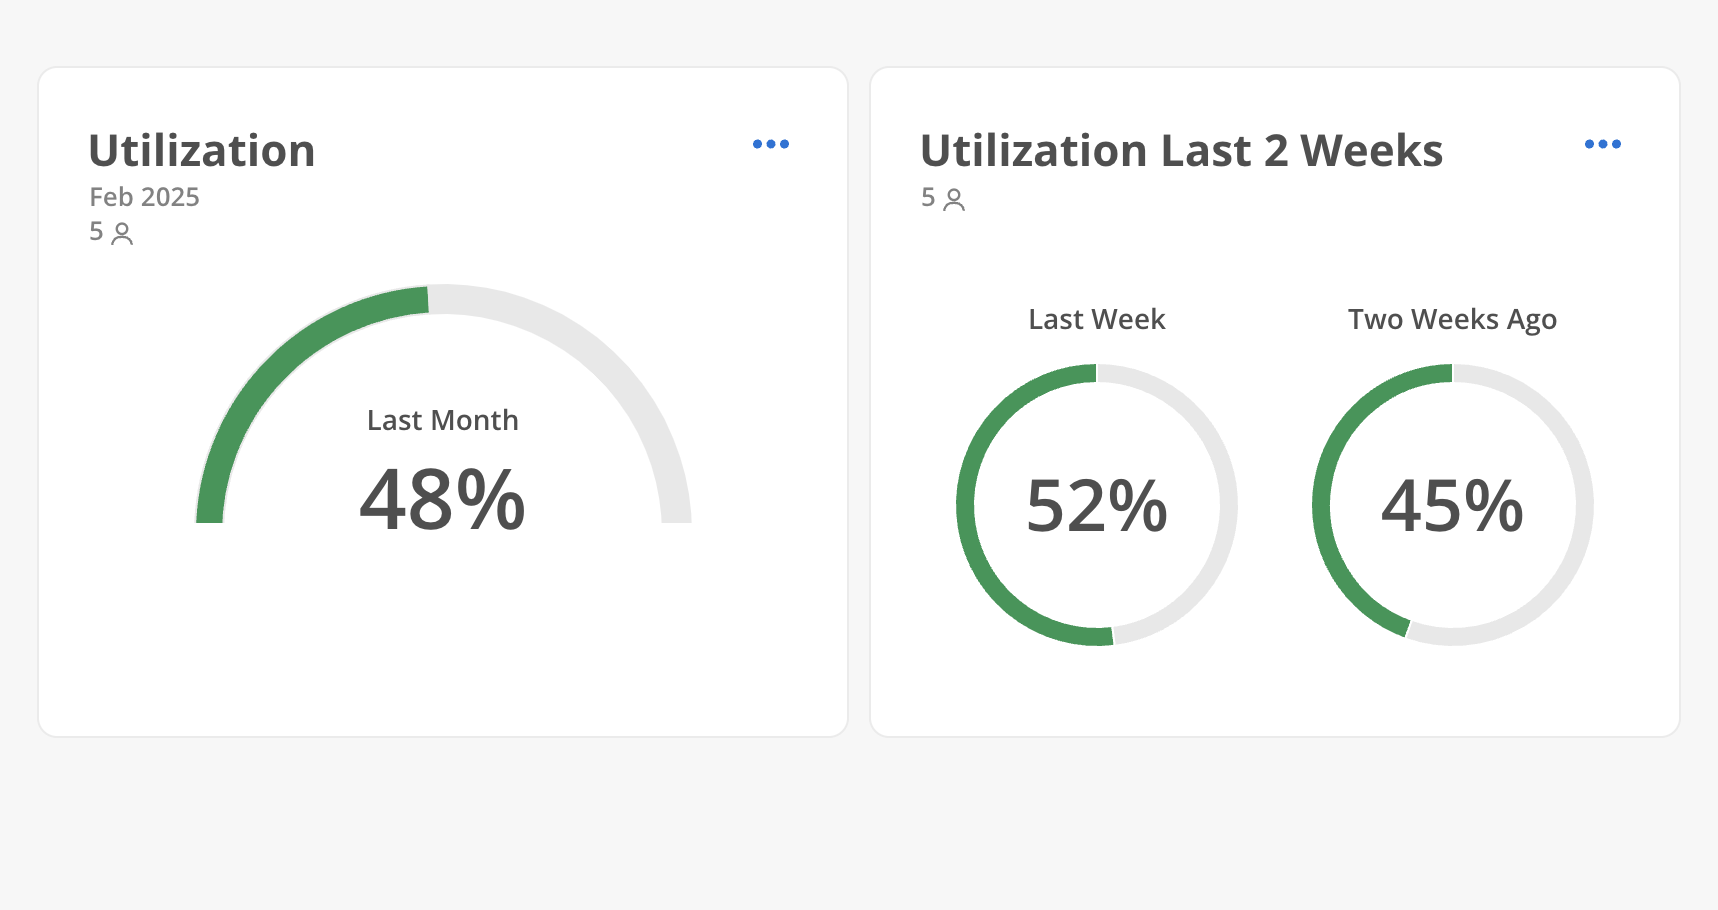
Utilization Summary: Shows a summary of the utilization for the selected Member over a specified date range.
Utilization Last 2 Weeks: Summarizes the utilization of the selected Member for the current and upcoming week.
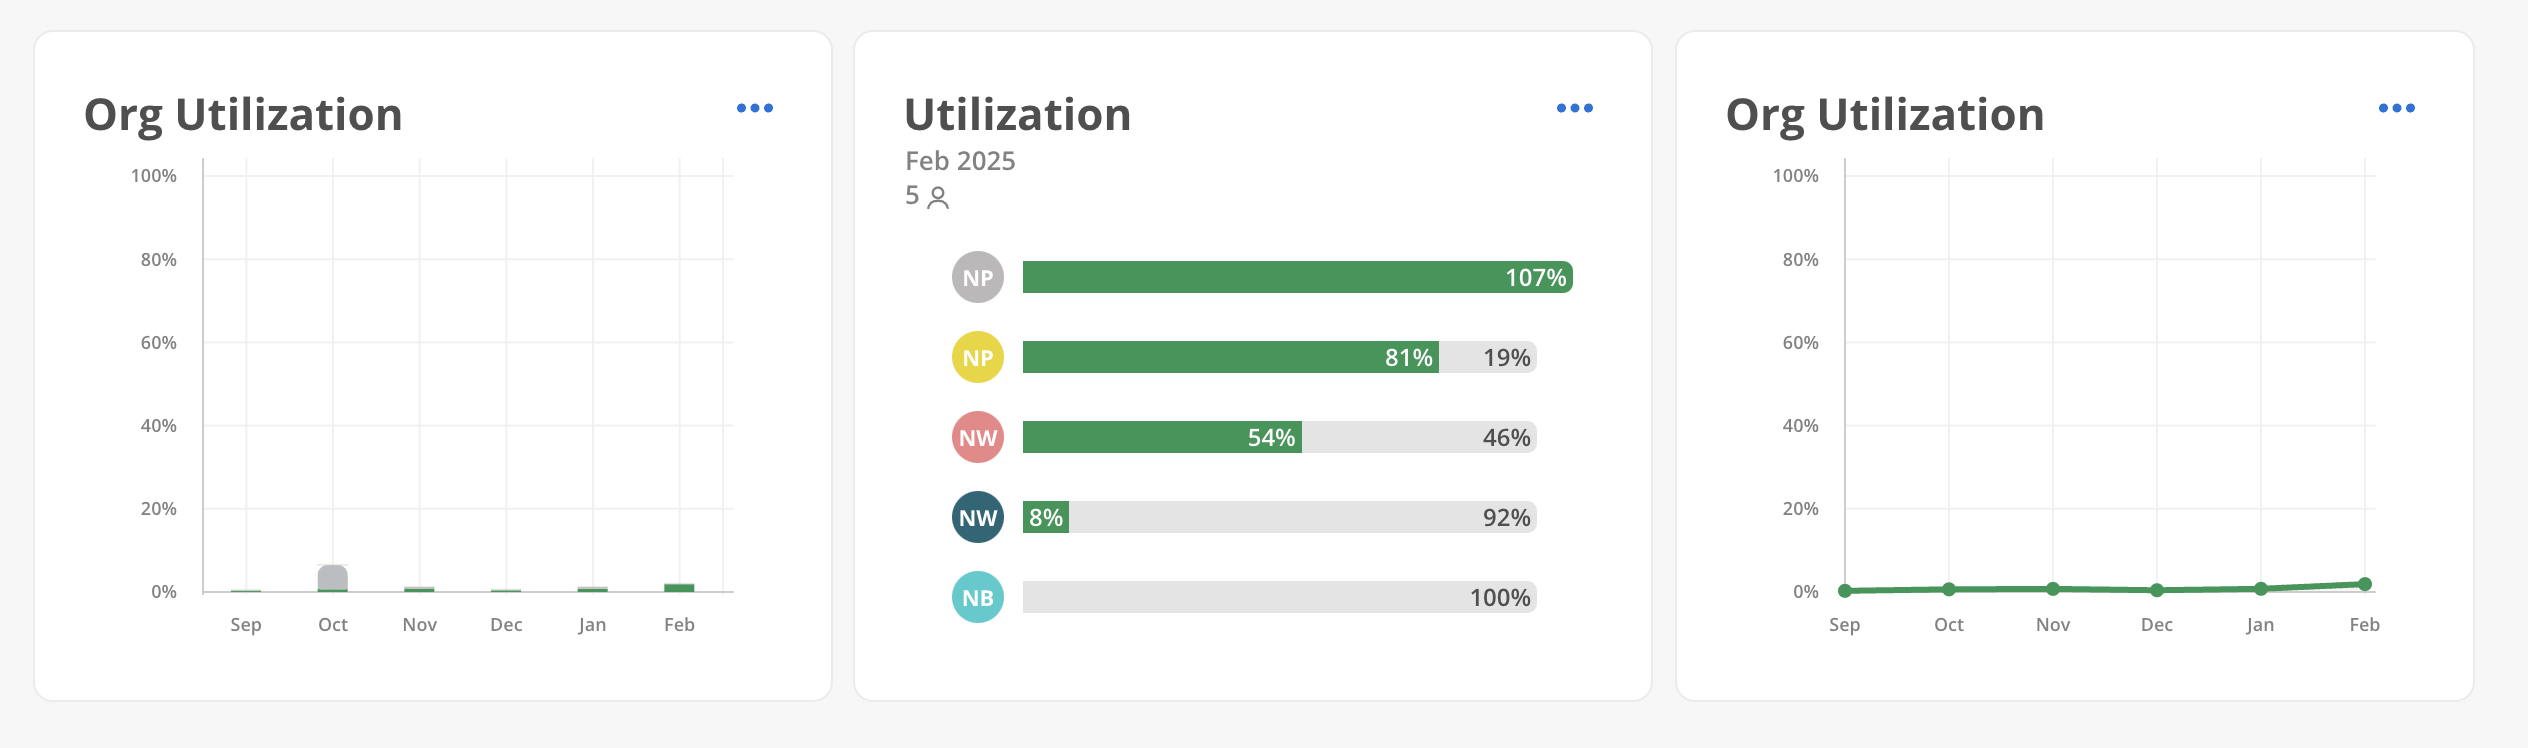
Org Utilization: Displays an organization-wide utilization overview in a bar chart for the selected period.
Utilization Bar Chart: Presents the utilization summary of the selected Member as a bar chart for a specified date range.
Org Utilization Graph: Provides an organization-wide utilization overview in a graphical format for the selected period.
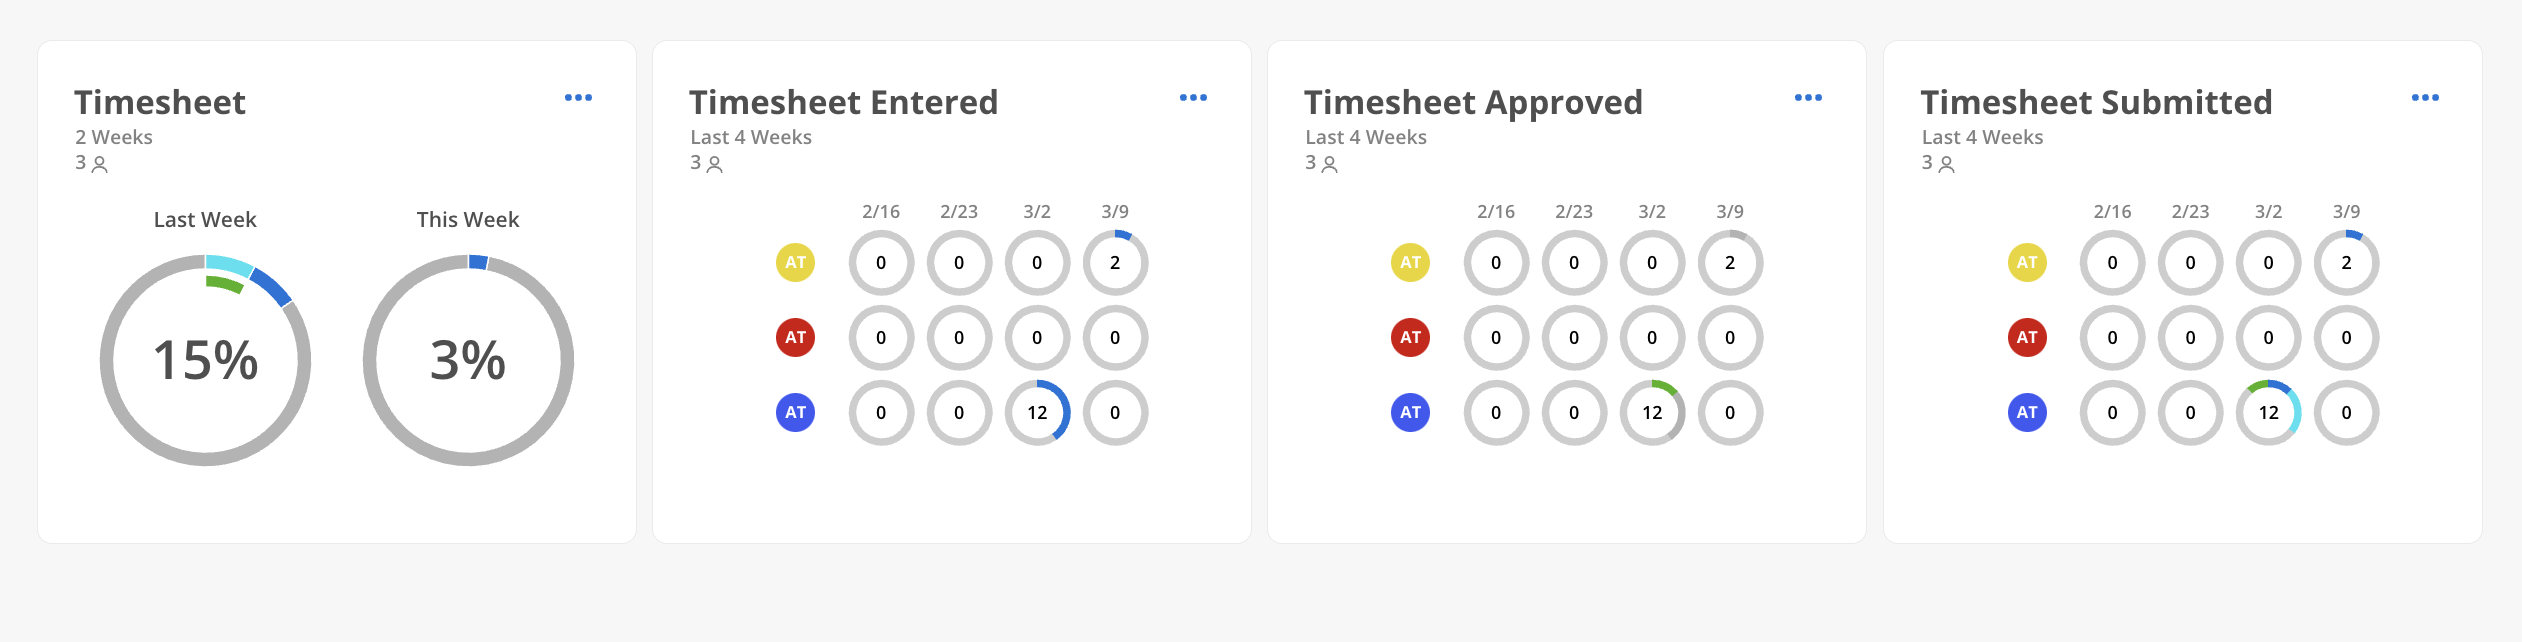
Timesheet: Presents an overview of Timesheets for the selected Member for the current and upcoming week.
Timesheets Entered: Displays a summary of entered and missing Timesheets for the selected Member over the past four weeks.
Timesheets Approved: Shows a summary of approved and unapproved Timesheets for the selected Member over the past four weeks.
Timesheets Submitted: Provides an overview of submitted, unsubmitted, and missing Timesheets for the selected Member over the past four weeks.
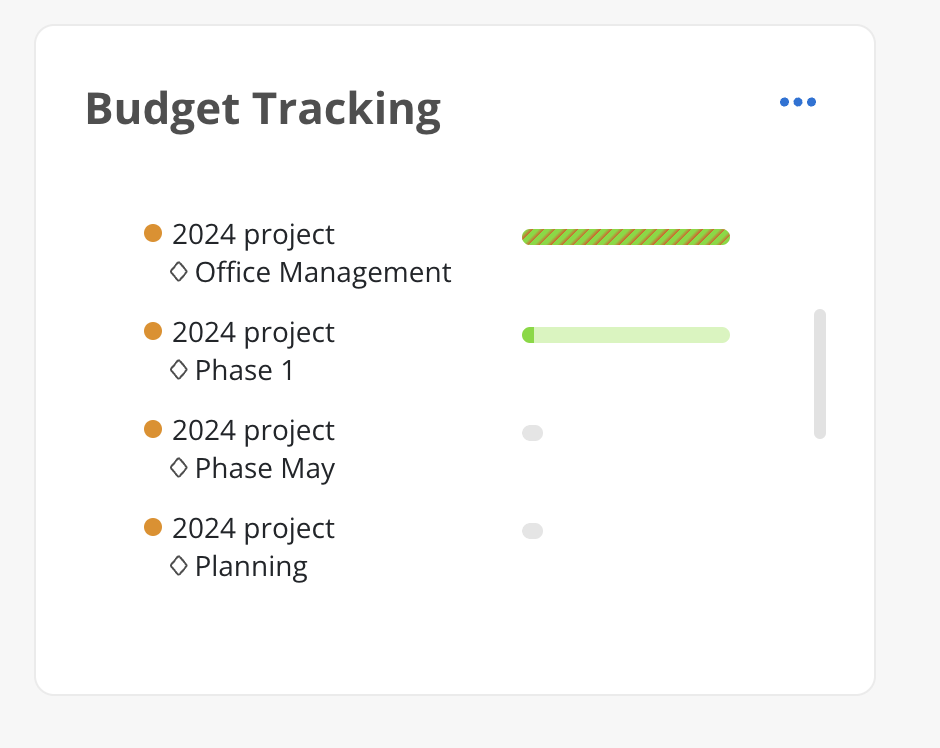
Budget Tracking: Offers an overview of Budget details for up to 1500 selected Phases or Subphases.