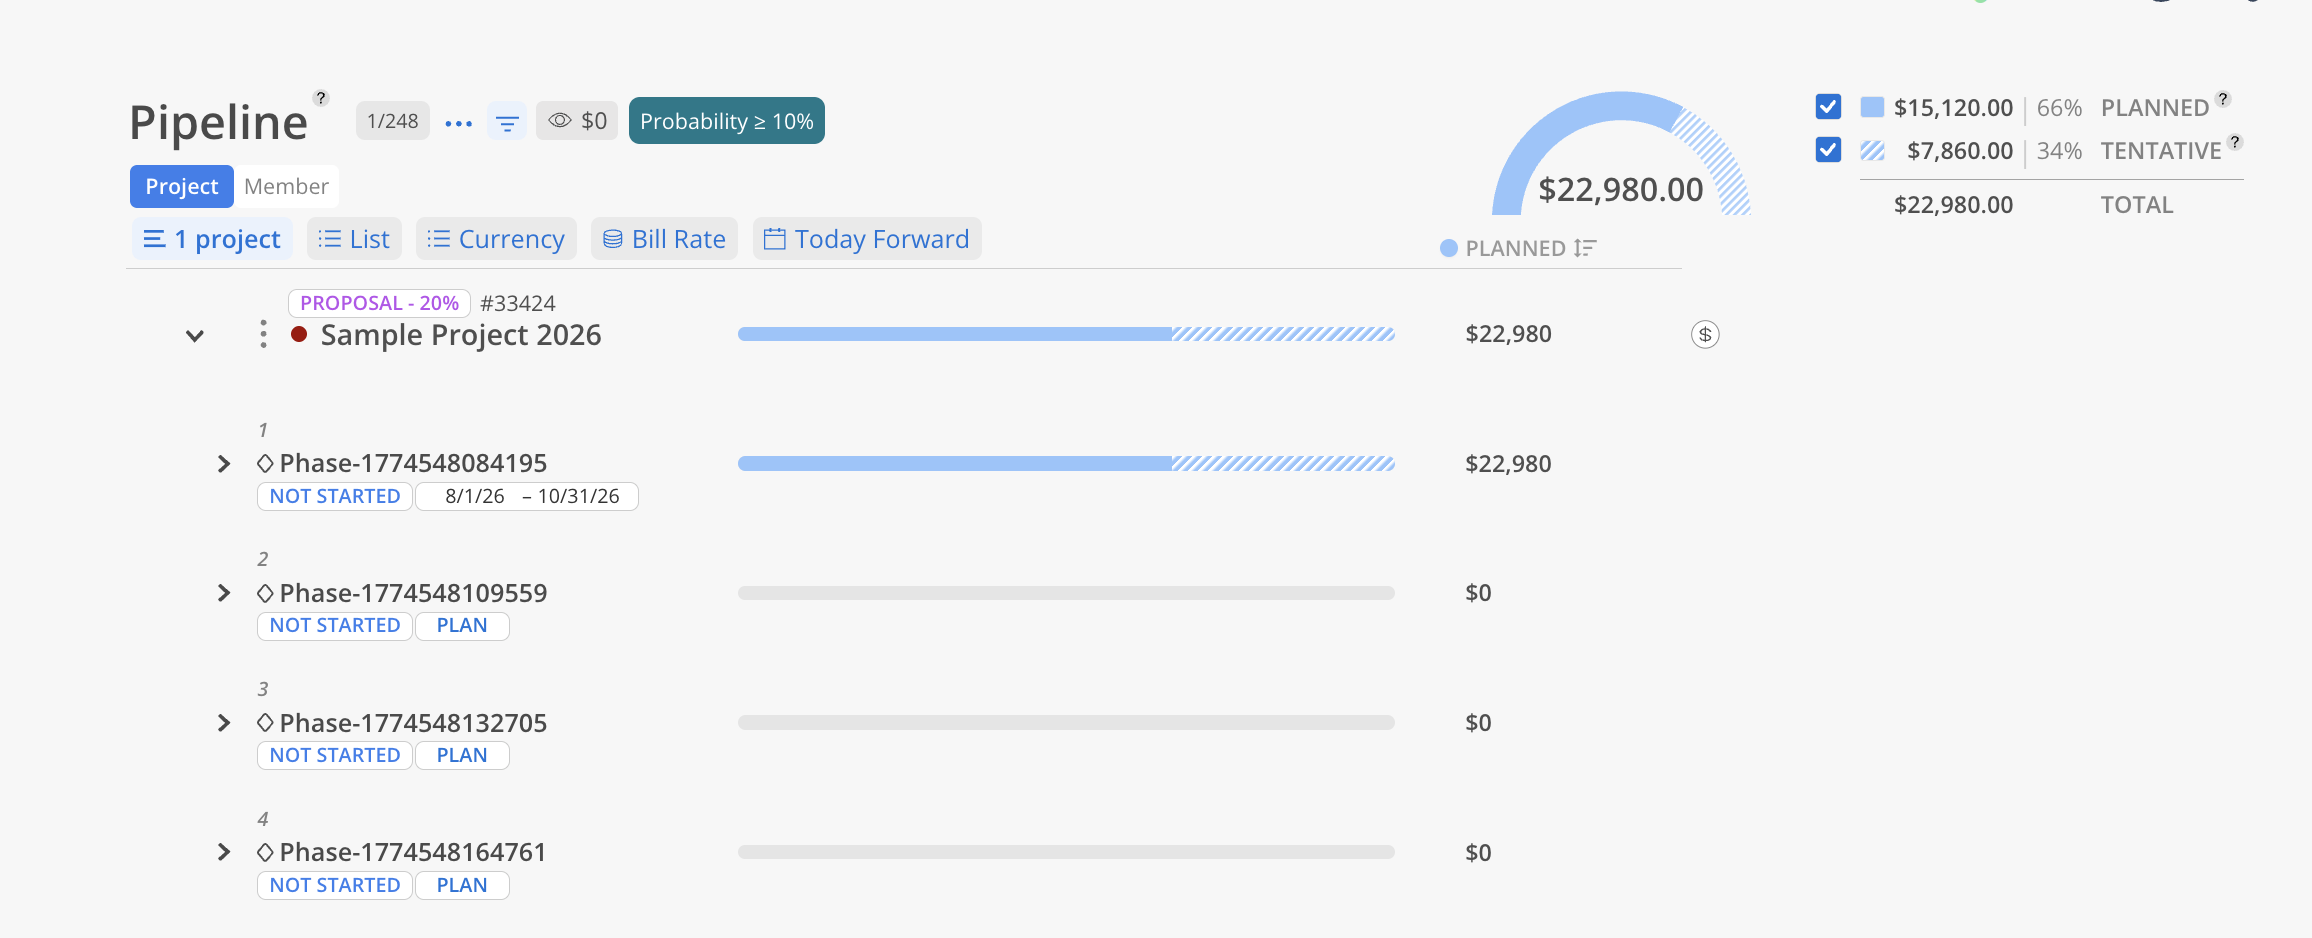
Unlike the Planned Time Report, which covers all of your confirmed work, this report is scoped to proposal projects only. It answers a forward-looking question: if these opportunities land, what will they cost in hours or dollars, and when? Access it from the Reports tab under Pipeline.
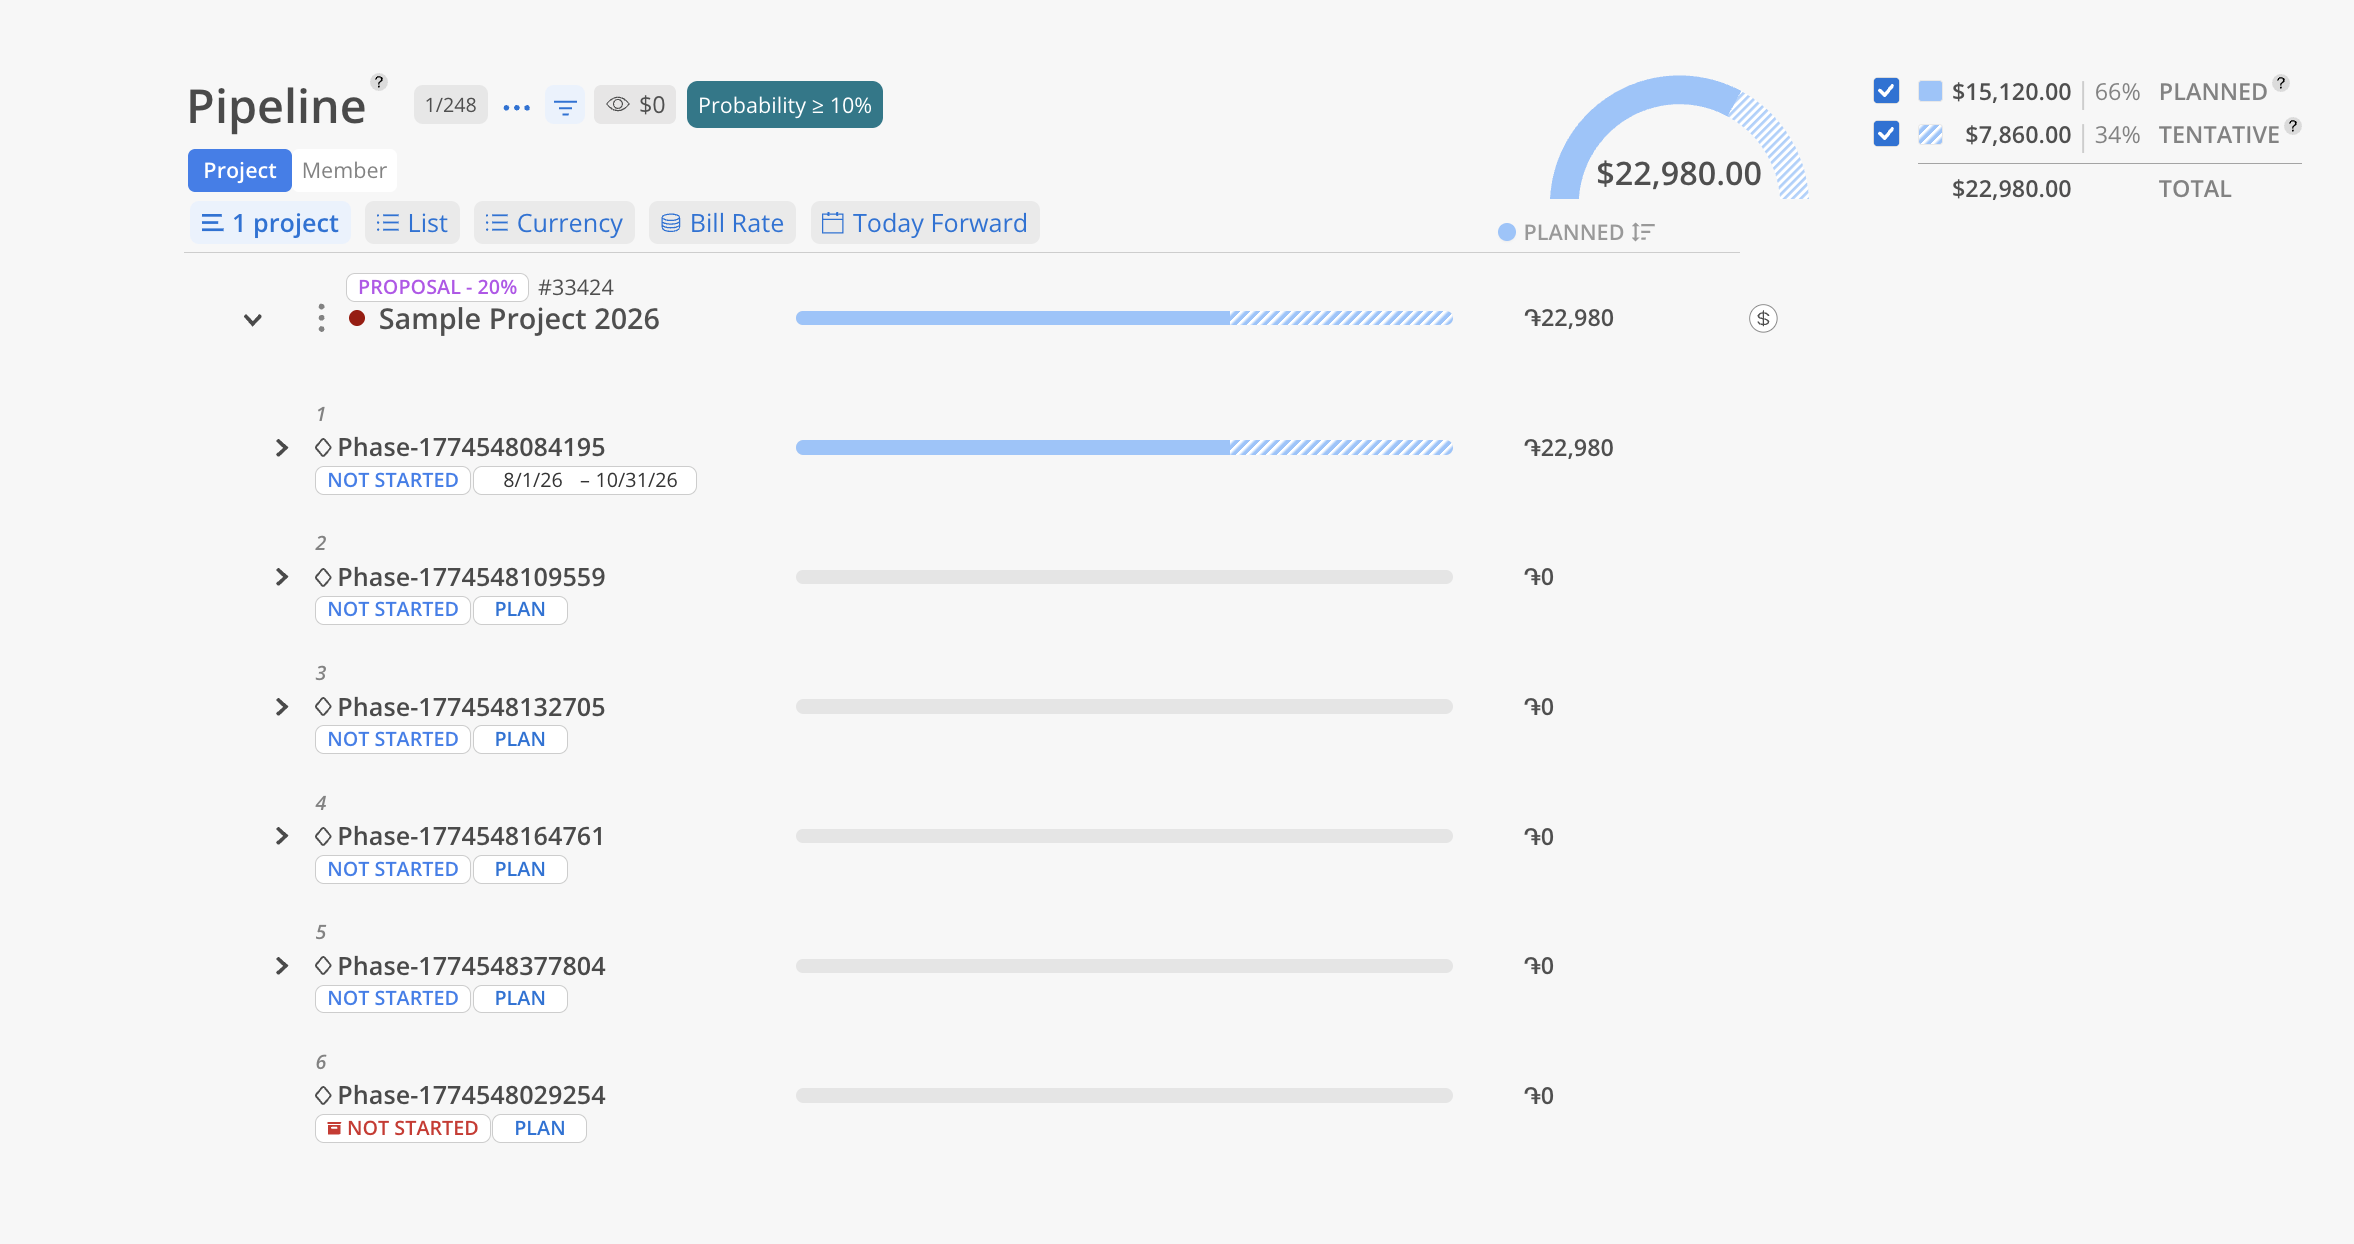
Use the Pipeline Report when you need to answer: "If our prospective work is won, how much of it is planned, when does it land, and what does it cost in hours or dollars?" This report is ideal for forecasting the resourcing and cost impact of deals still in the pipeline, narrowing to the opportunities most likely to close by setting a win-probability floor, spotting where prospective work is concentrated across members, projects, and phases before it becomes committed work, and sanity-checking capacity for proposals before they convert to active projects.
It's ideal for:
Forecasting the resourcing and cost impact of deals still in the pipeline.
Focusing on the opportunities most likely to close, by setting a win-probability floor.
Spotting where prospective work is concentrated across members, projects, and phases before it becomes committed work.
Sanity-checking capacity for proposals before they convert to active projects.
The Bars
Solid blue = confirmed planned time
Hashed blue = tentative planned time
Summary & Toggles (top right)
Summary total — total planned dollars or hours across the proposals currently in view.
Planned — the confirmed planned amount, with its share of the total.
Tentative — toggle tentative plans on or off.
Total — combined planned + tentative amount.
Controls
Currency / Hours toggle — switch between dollars and hours.
Bill Rate dropdown — value the work at its bill rate or its cost rate.
Probability filter — set a win-probability floor for which proposals appear (see below).
Date range selector — this month, 30 days, all time, or custom.
Display options — Breakdown, Bar, or Graph view.
Print — print or export the current view.
The probability filter is the control unique to the Pipeline Report. Every proposal project can carry a win probability: the percentage set on the project when its budget status is Proposal, shown on the project as, for example, "Proposal - 30%."
The filter sets the minimum win probability a proposal must have to appear in the report. It defaults to ≥ 10%. Choosing All brings in proposals that do not yet have a probability set.
This report has 2 views: Member, Project. Each view shows the same underlying proposal data organized from a different starting point. Rows expand for hierarchical detail — project to phase, or member to project.
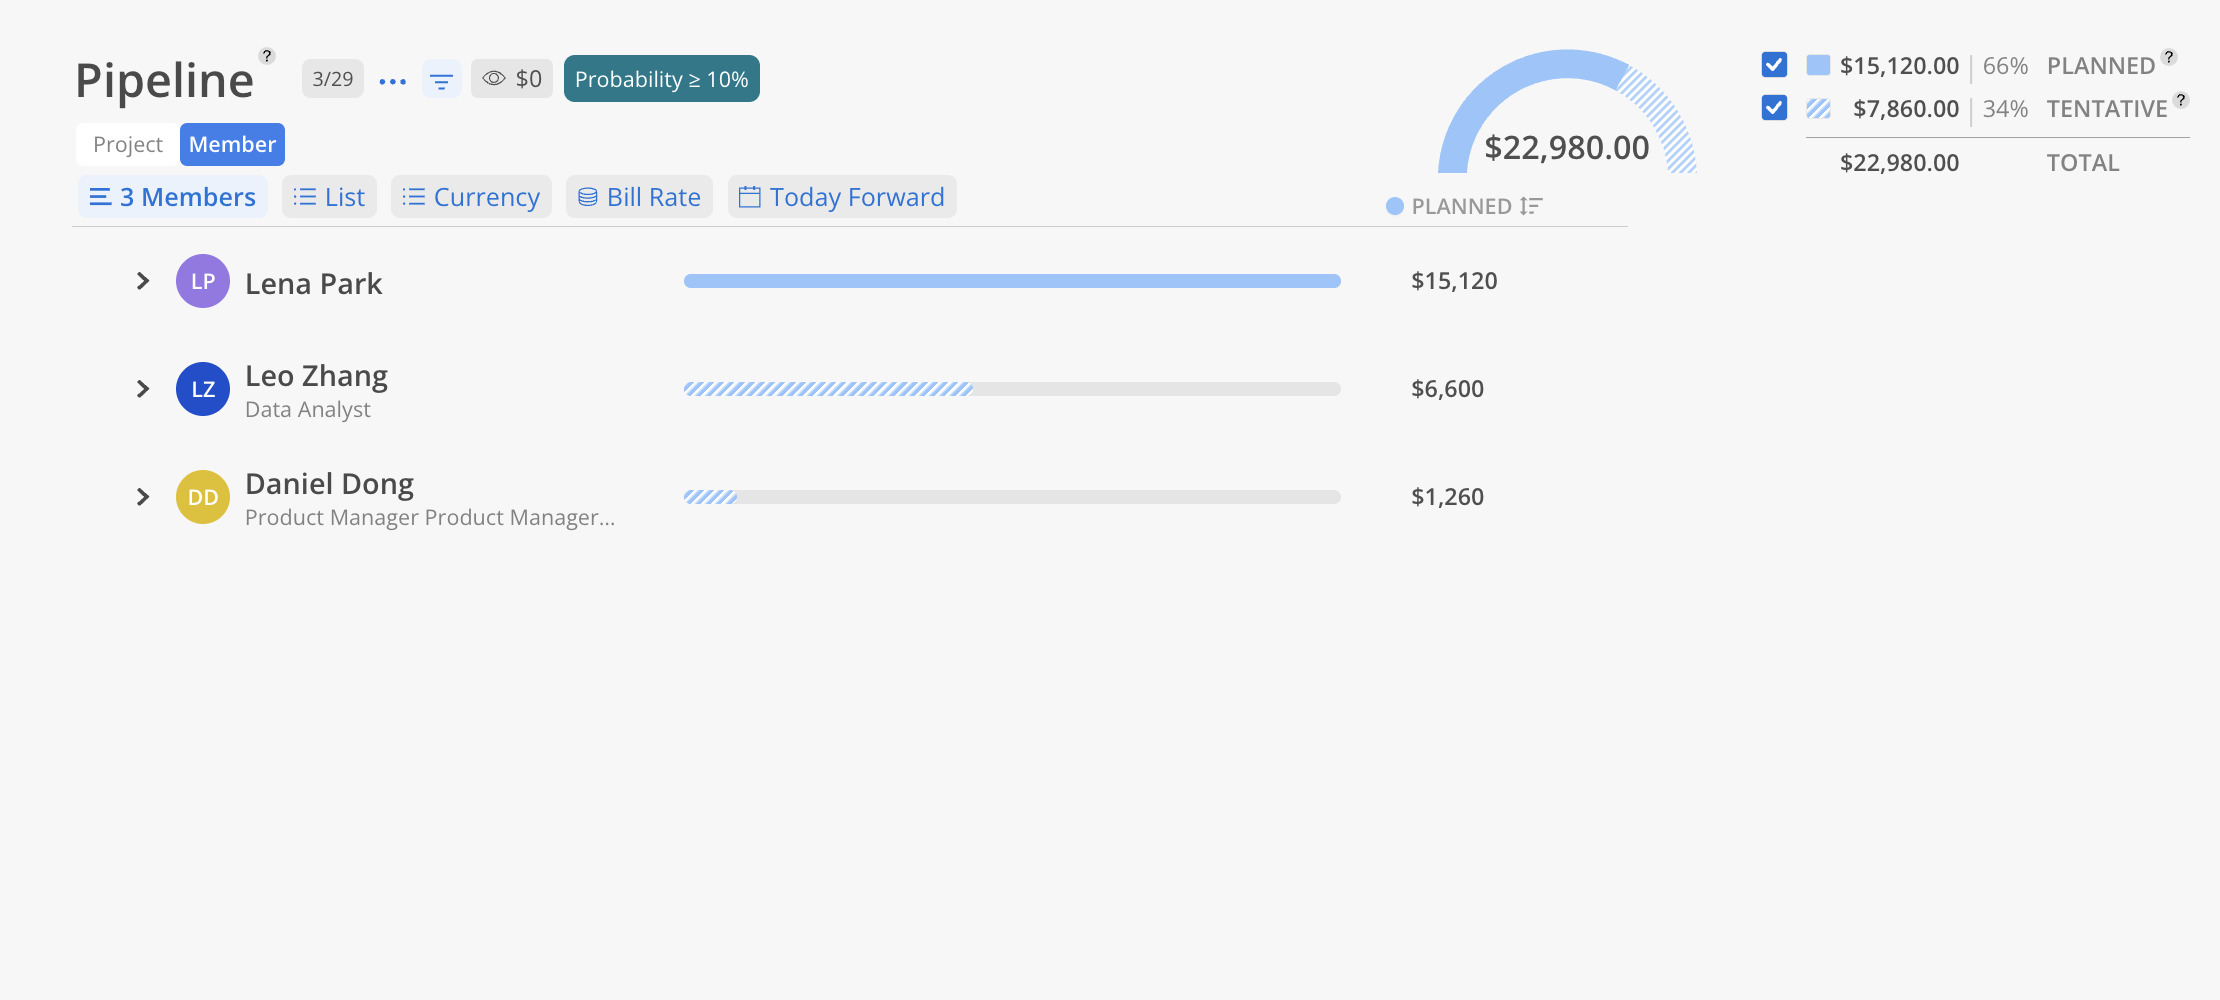
The Member view shows the planned time each person is slated for across proposal projects in the selected date range.
Click the Member tab at the top.
Select members using the member selector or filters.
Choose a date range.
Toggle between hours and currency.
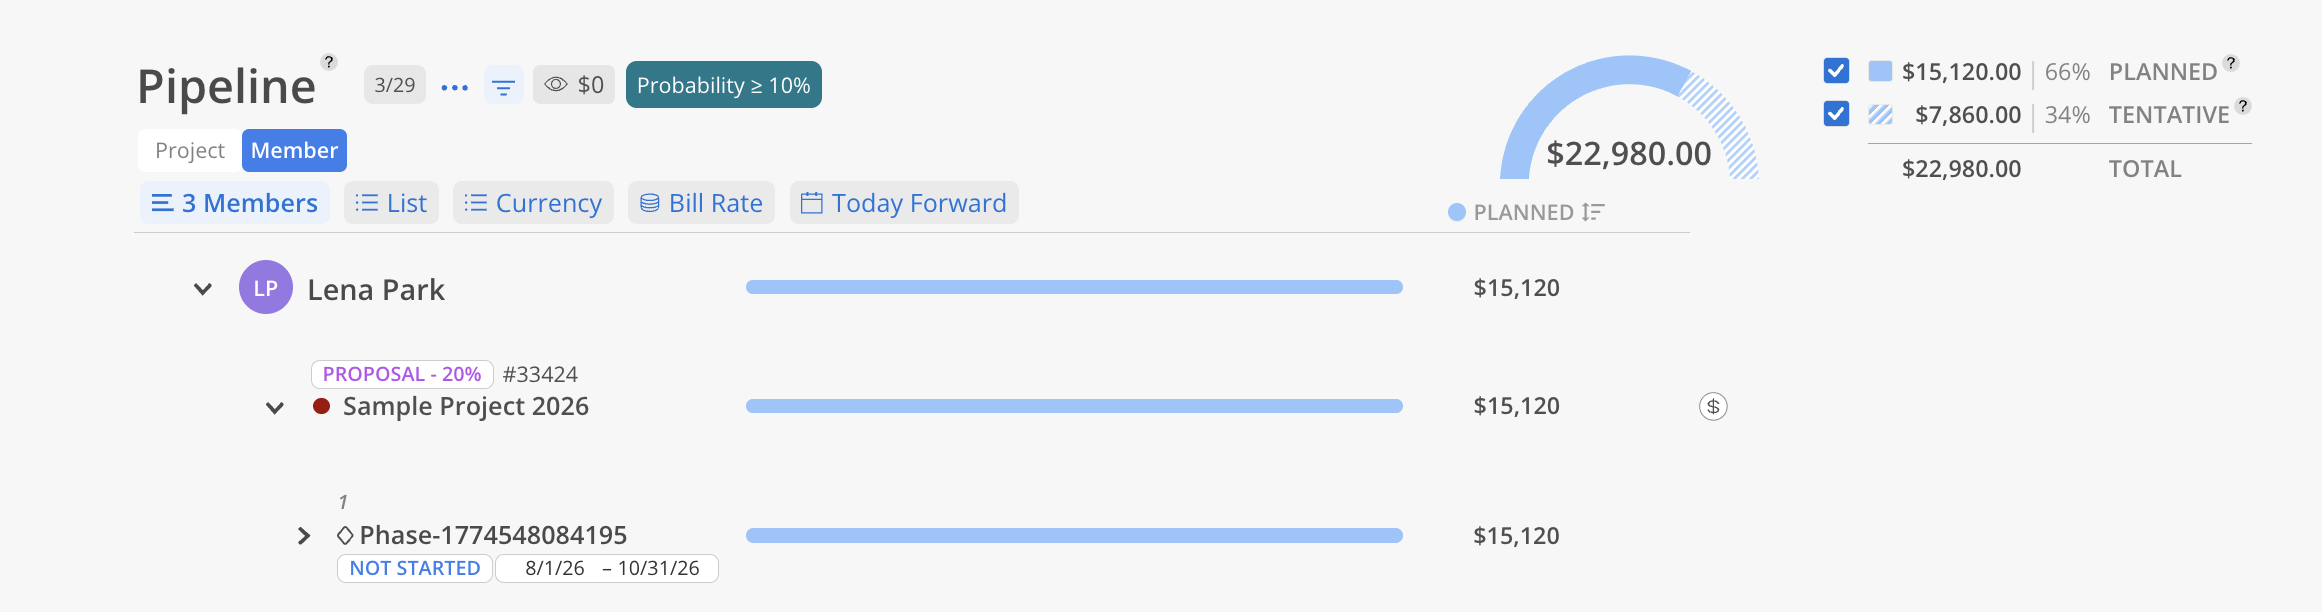
Each member row shows their total planned hours or dollars. Expand a member to see which projects they are planned on, and expand further to see the specific phases. Use the eye icon to hide members with zero planned time.
Expand a member to see which projects and phases their planned time is allocated to, with dollar amounts at each level.
The Project view shows total planned time per proposal project over the selected date range.
Click the Project tab at the top.
Select projects by name, number, or portfolio.
Choose a date range.
Toggle between hours and currency.
Each project row shows total planned hours or dollars. Expand to see the phase breakdown, and expand further to see individual member allocations within each phase.