The Utilization Report provides a summary of all Billable and Non-Billable time entries, displayed as a percentage of utilization based on each member's Work Capacity. This information can be viewed in various formats.
Time Off Timesheets are also included in Billable/Non-Billable time depending on the billable status of the Work Category selected in this report.
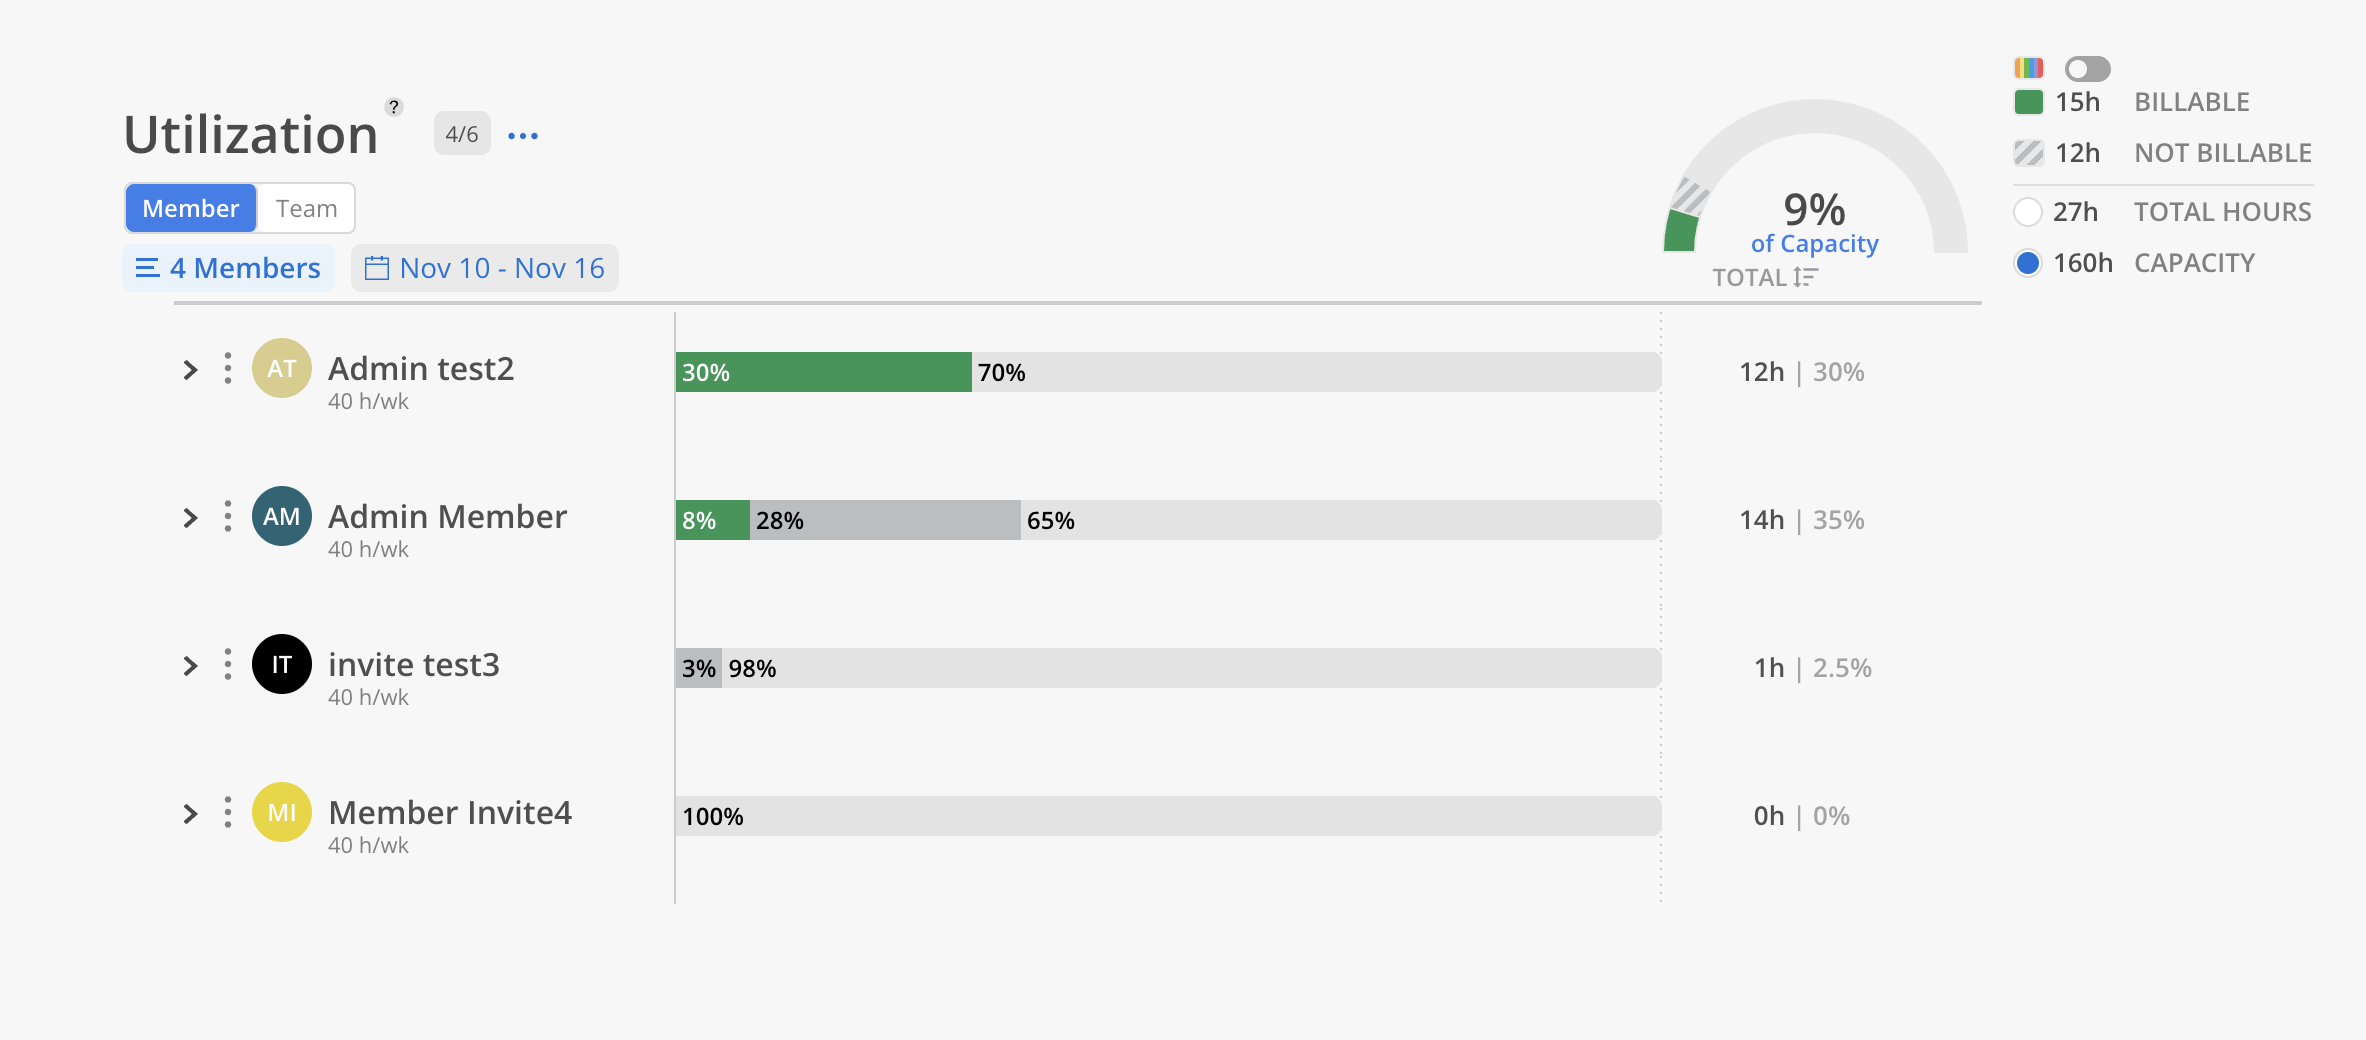
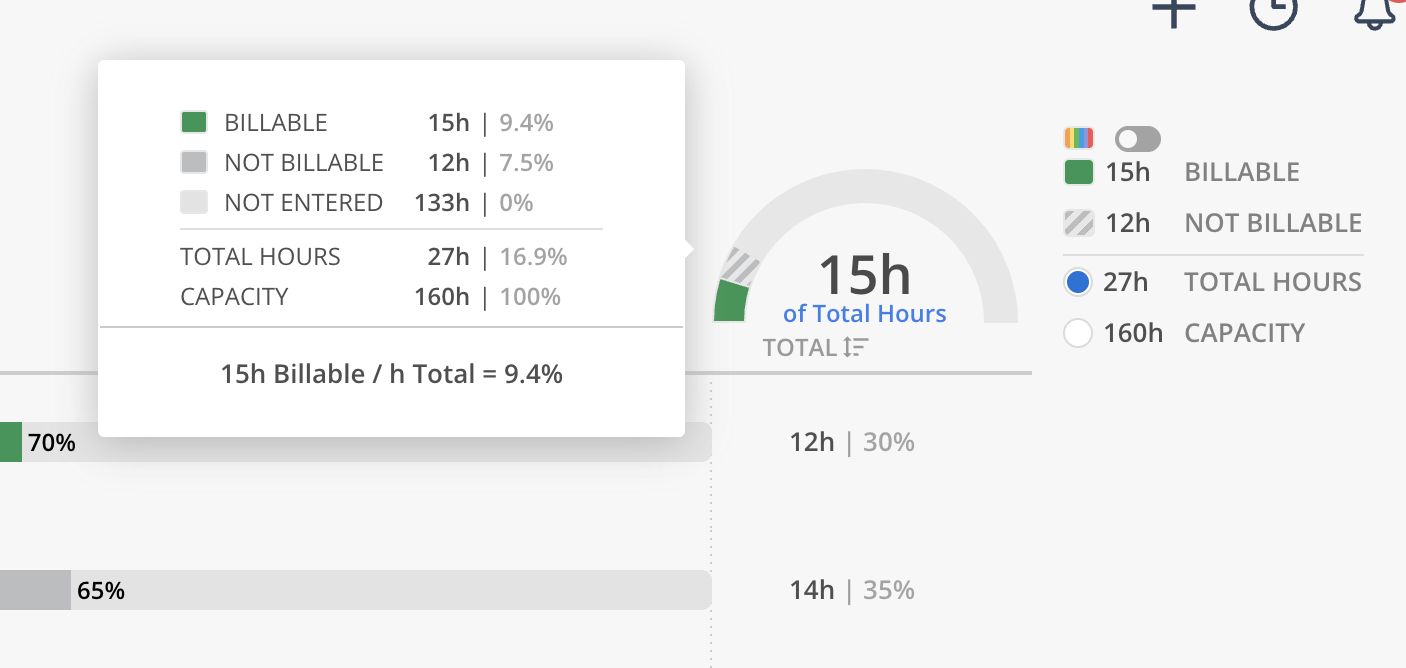
The summary widget at the top displays the percentage of billable time compared to capacity, by default. Hovering over the widget display a tooltip with detailed information, showing the total number of billable and non-billable hours. Time Off hours are included in these totals.
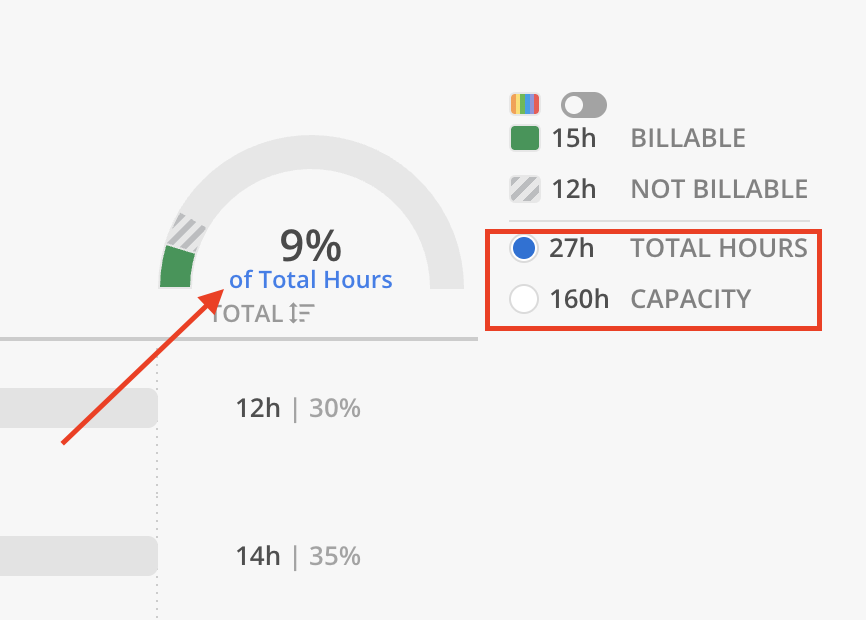
To change the calculation displayed in the chart:
Click the radio button next to Capacity in the summary panel,
or
Click the blue "Total Hours" label on the chart.
This updates the metric to show the percentage of Billable Time versus Capacity Hours instead of Billable Time versus Total Hours.
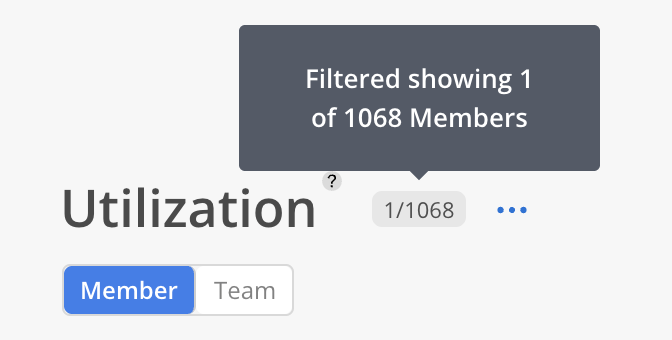
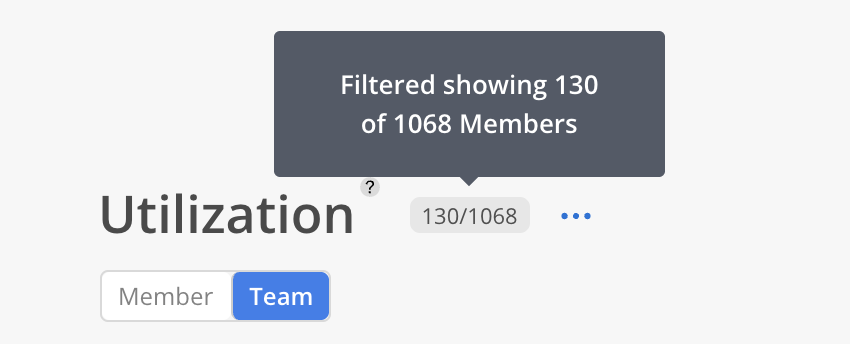
On both Member and Team tab, next to the Report title, the number of filtered Members is displayed alongside the total count.
Display by individual members, and expand each member in order to see the specific projects time has been entered on.
When a member is archived, their capacity will be considered zero from the date of archiving onwards. Their previous capacity will remain unchanged, but any future capacity will be zero.
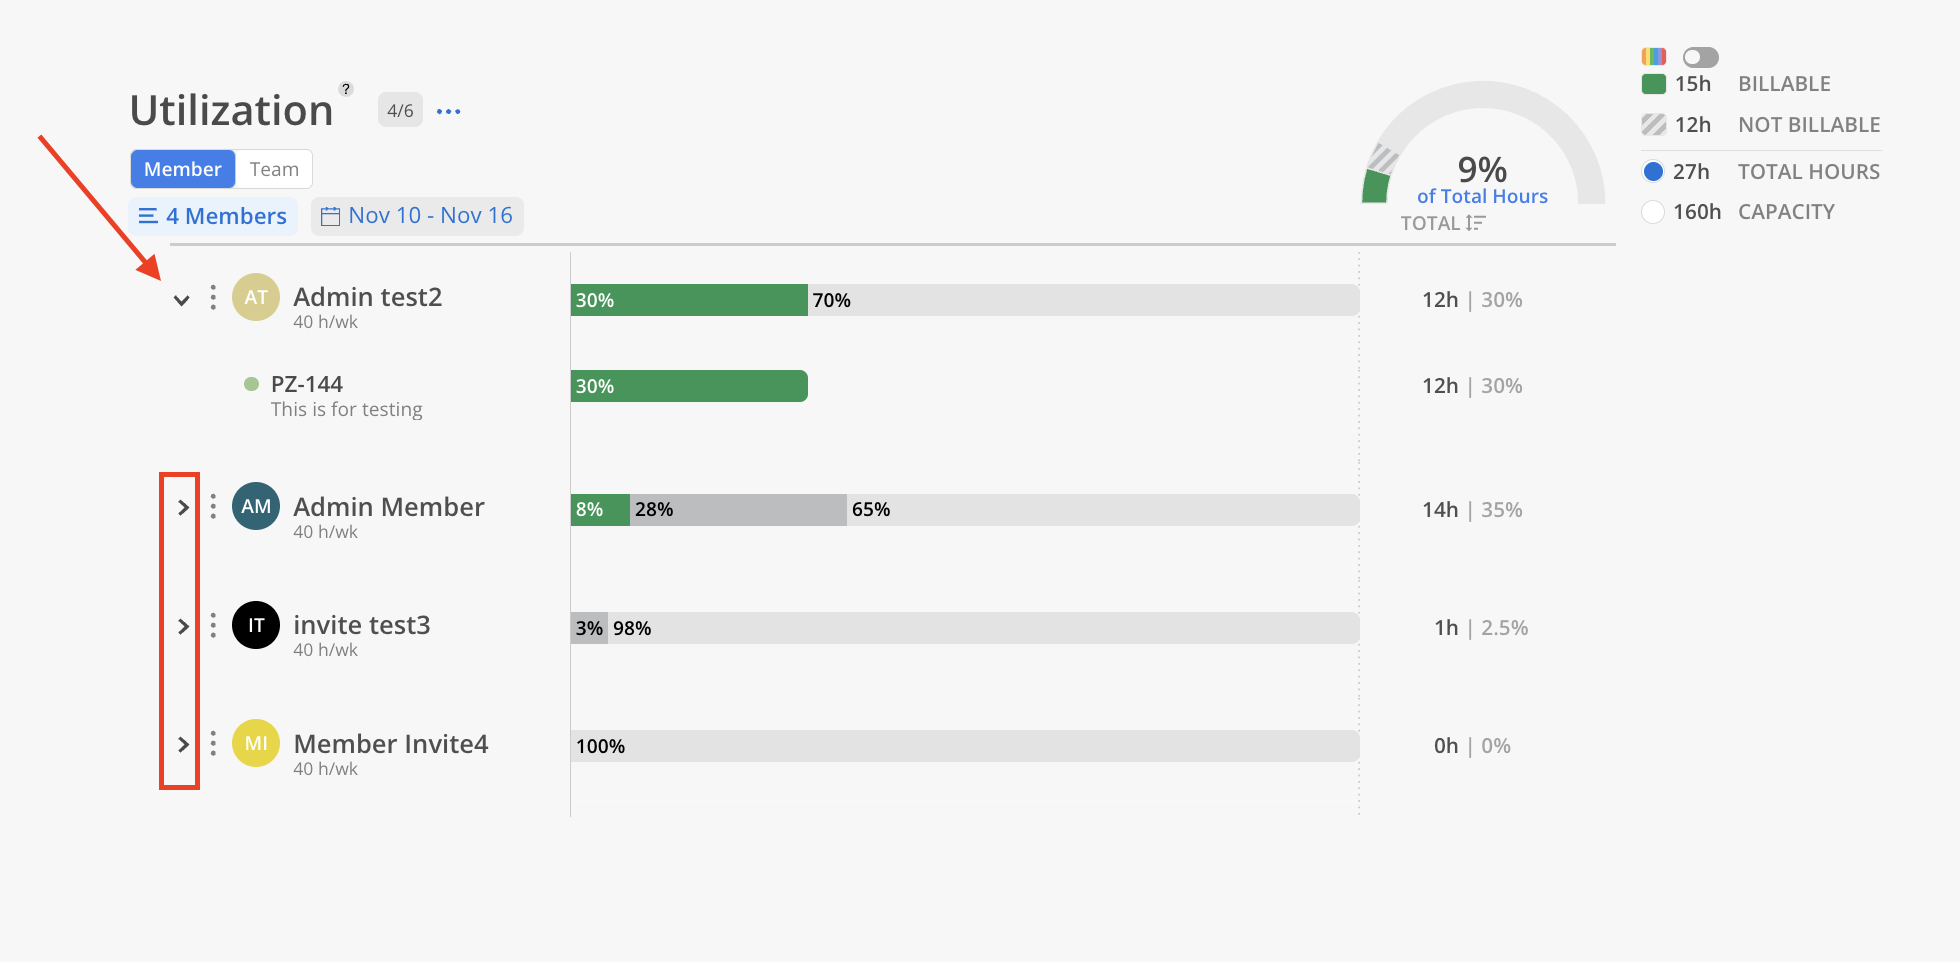
Within this view you can select "Members" to choose which members to display. Click the date to select date range. All selected views and Members in this report are automatically saved for future use.
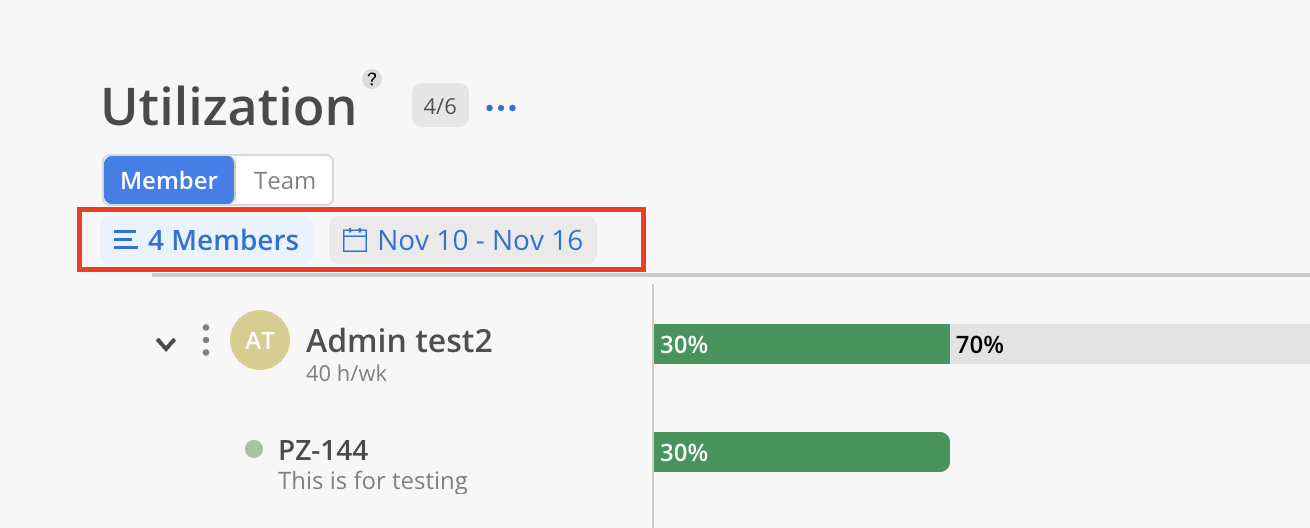
When selecting members
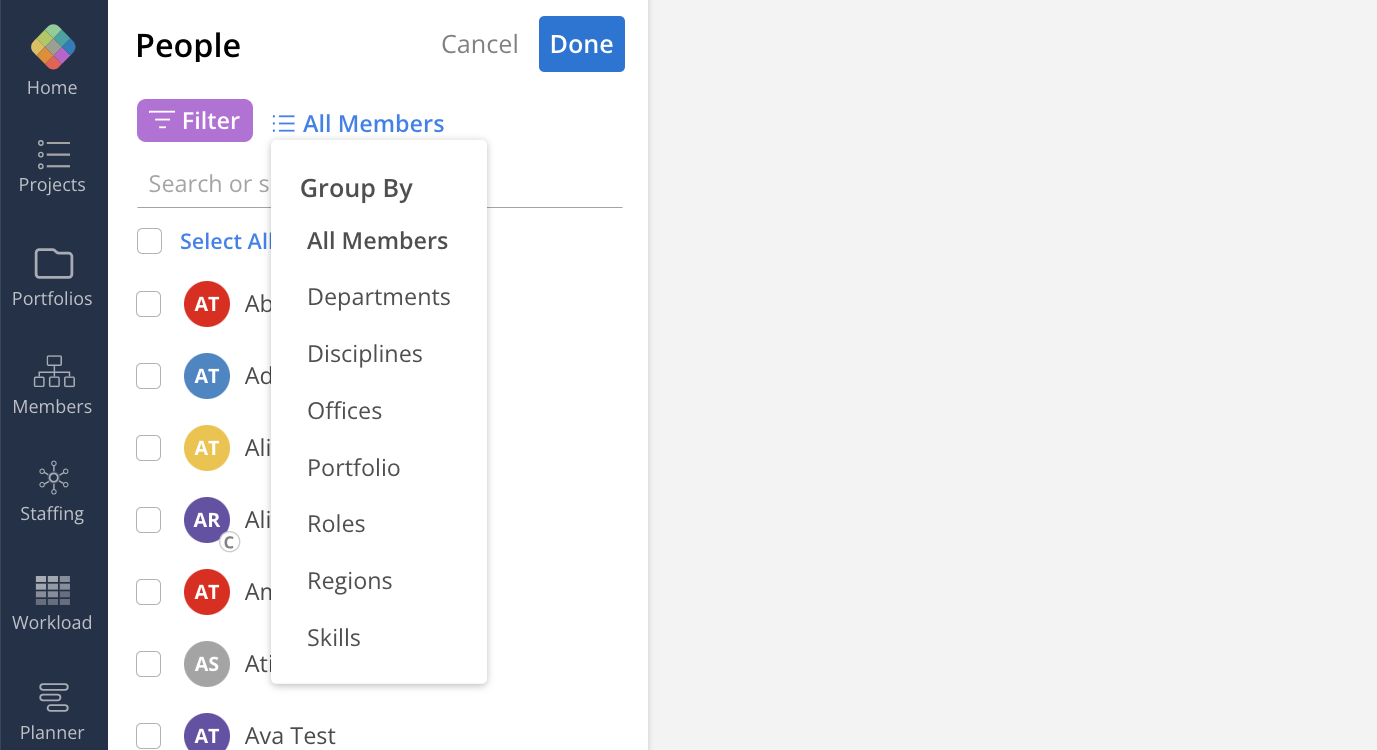
Click All Members to group Members by Departments, Disciplines, Offices, Portfolios, Roles, Regions, and Skills
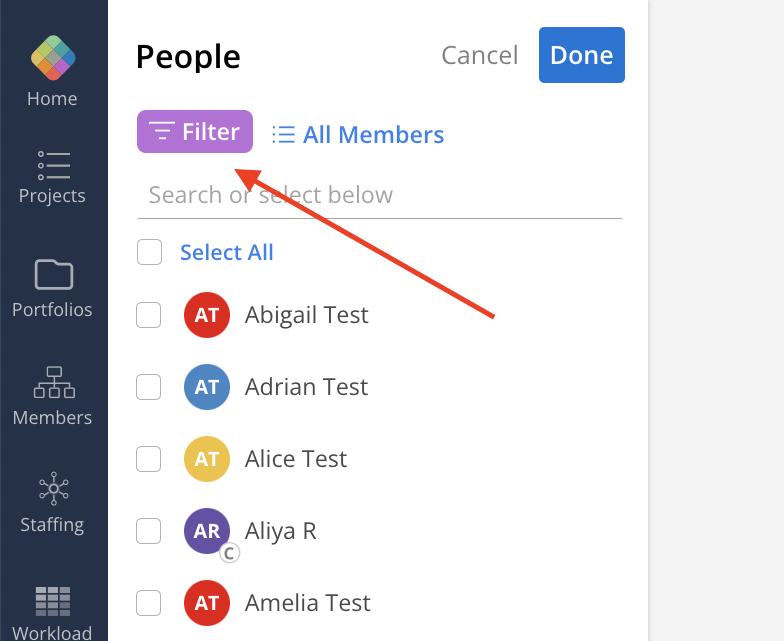
Filter the Members list by selecting the Filter button located in the top left corner.
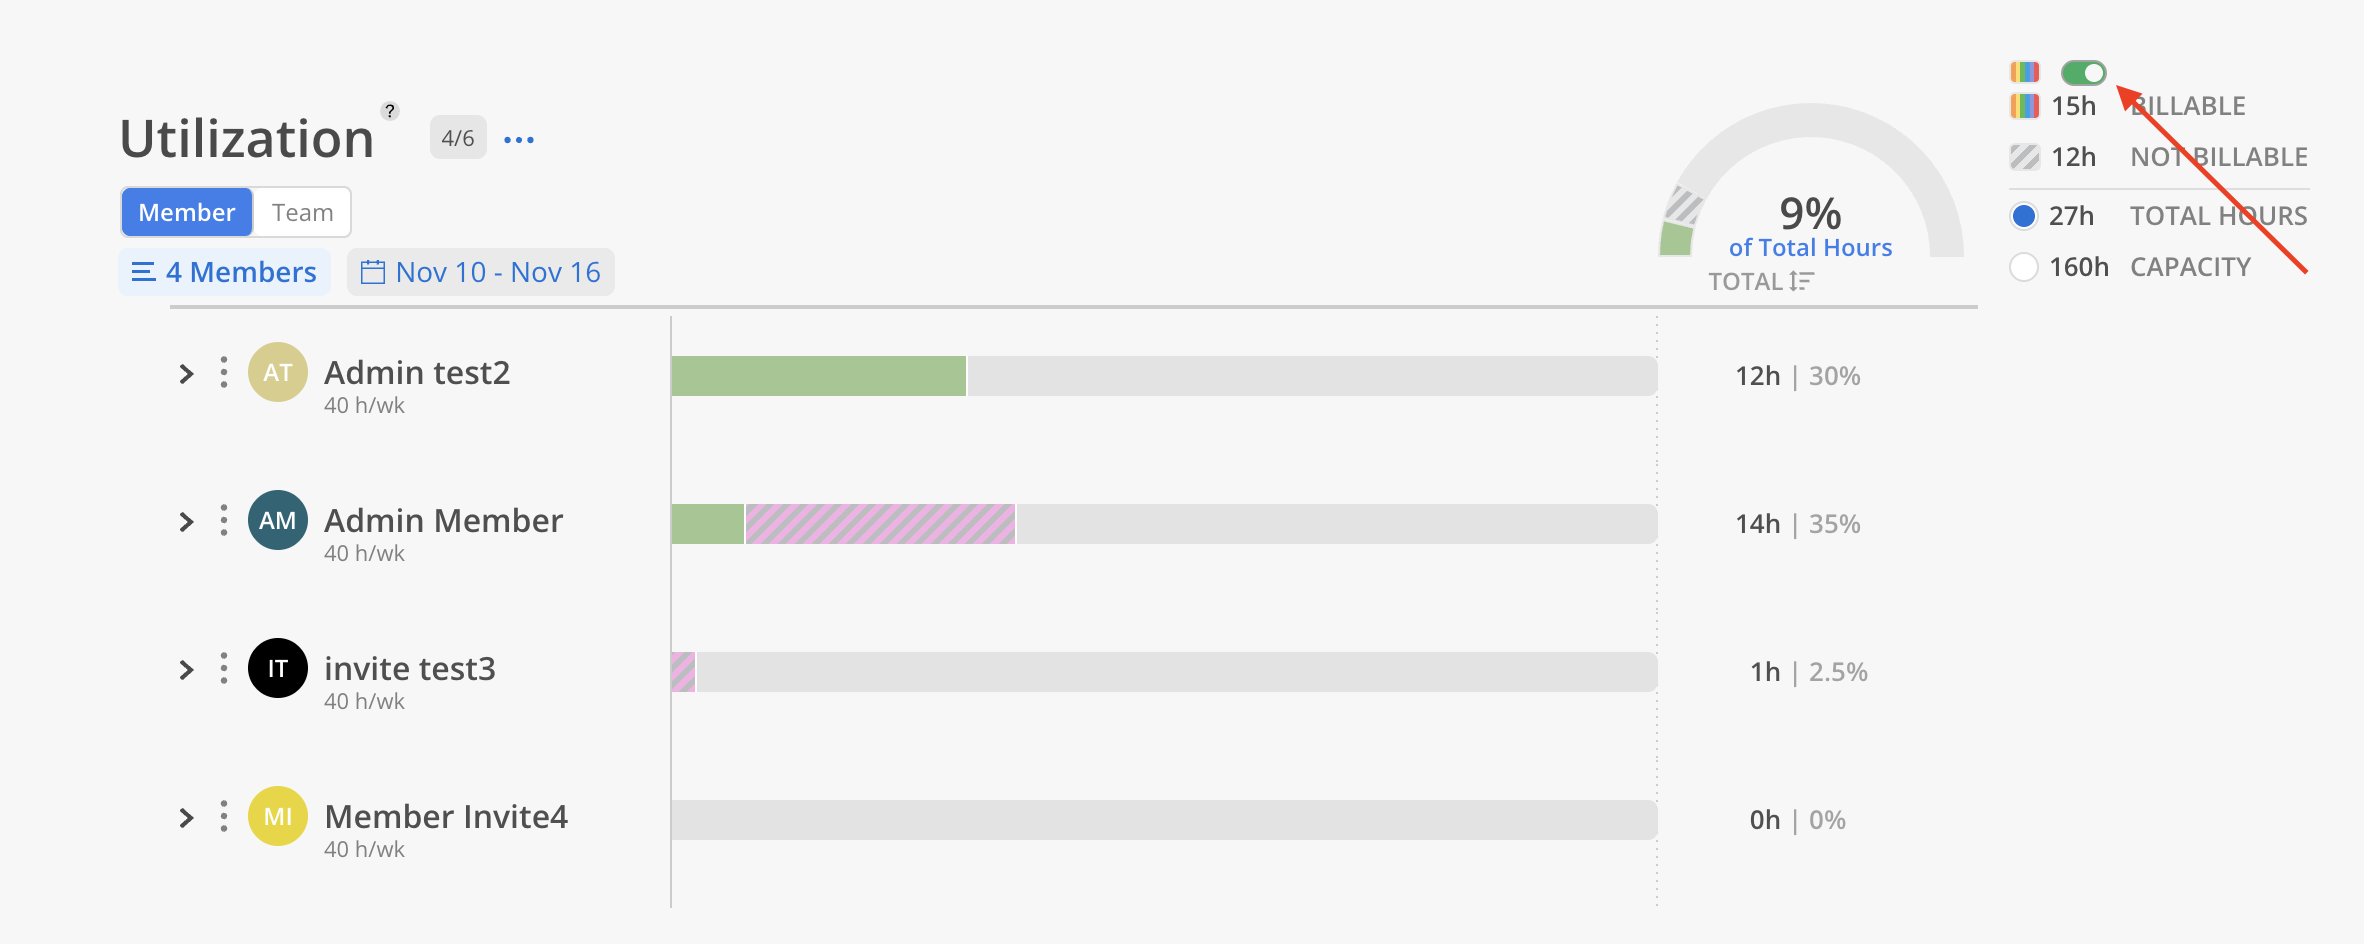
You can also update the color toggle switch in order to see a color breakdown of the time entered on each project.
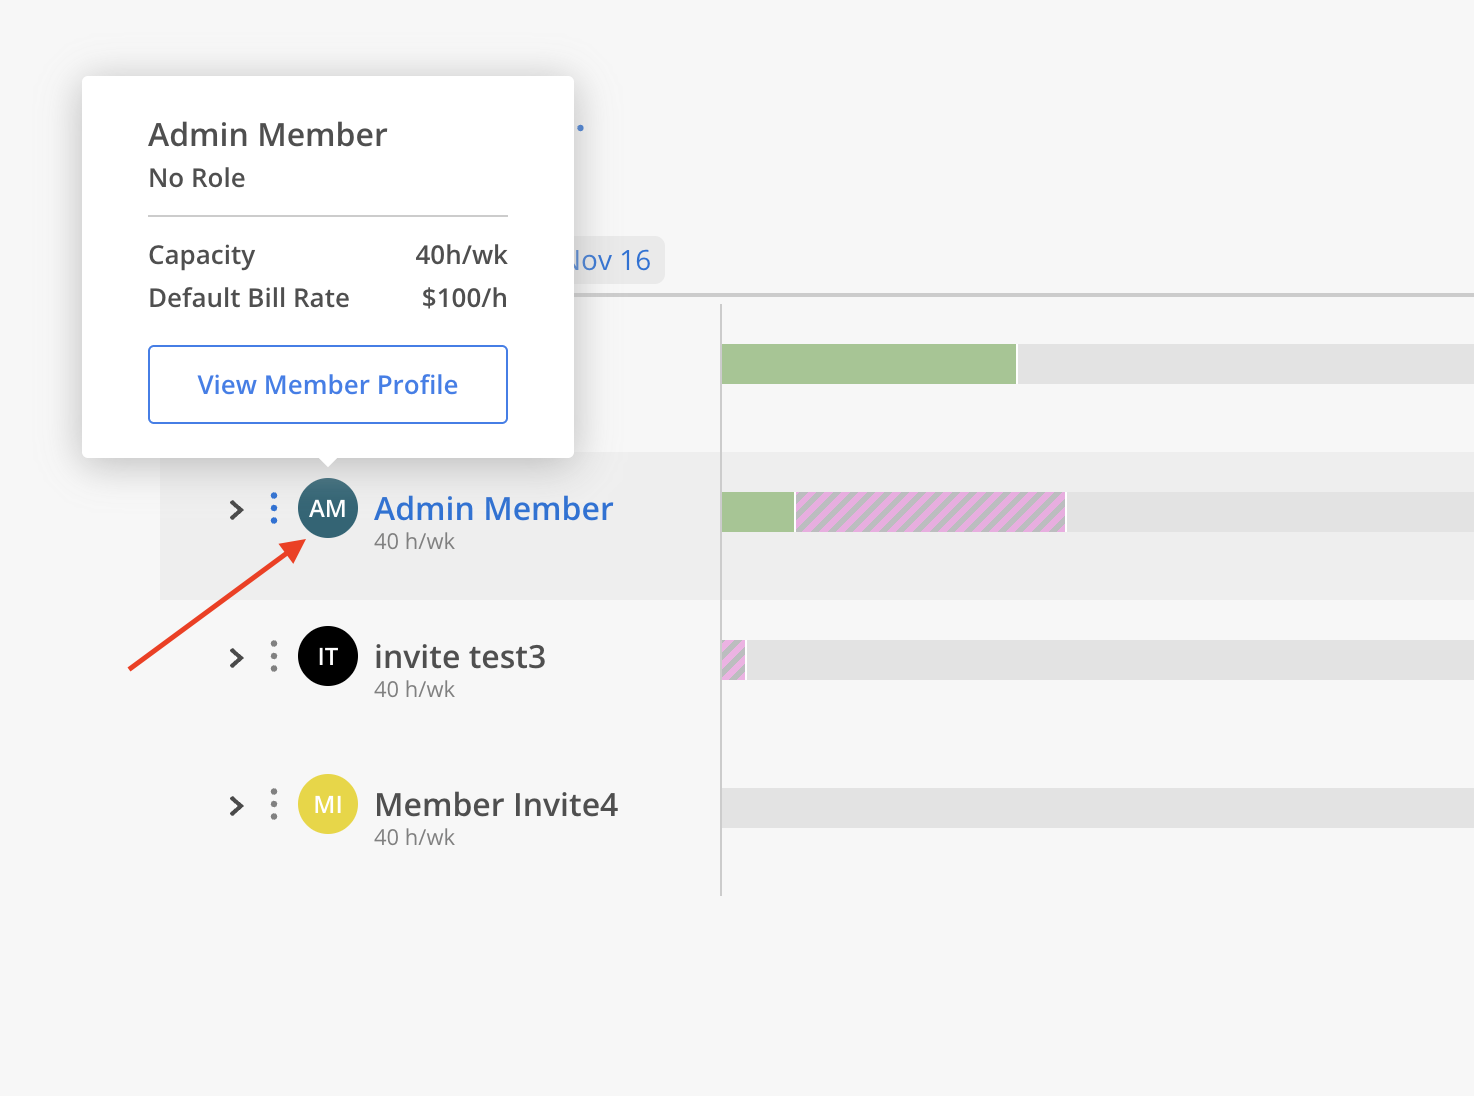
Hover on the member to see more details, including role, capacity, and bill rate (if any). Click View Member Profile to see the profile of this member.
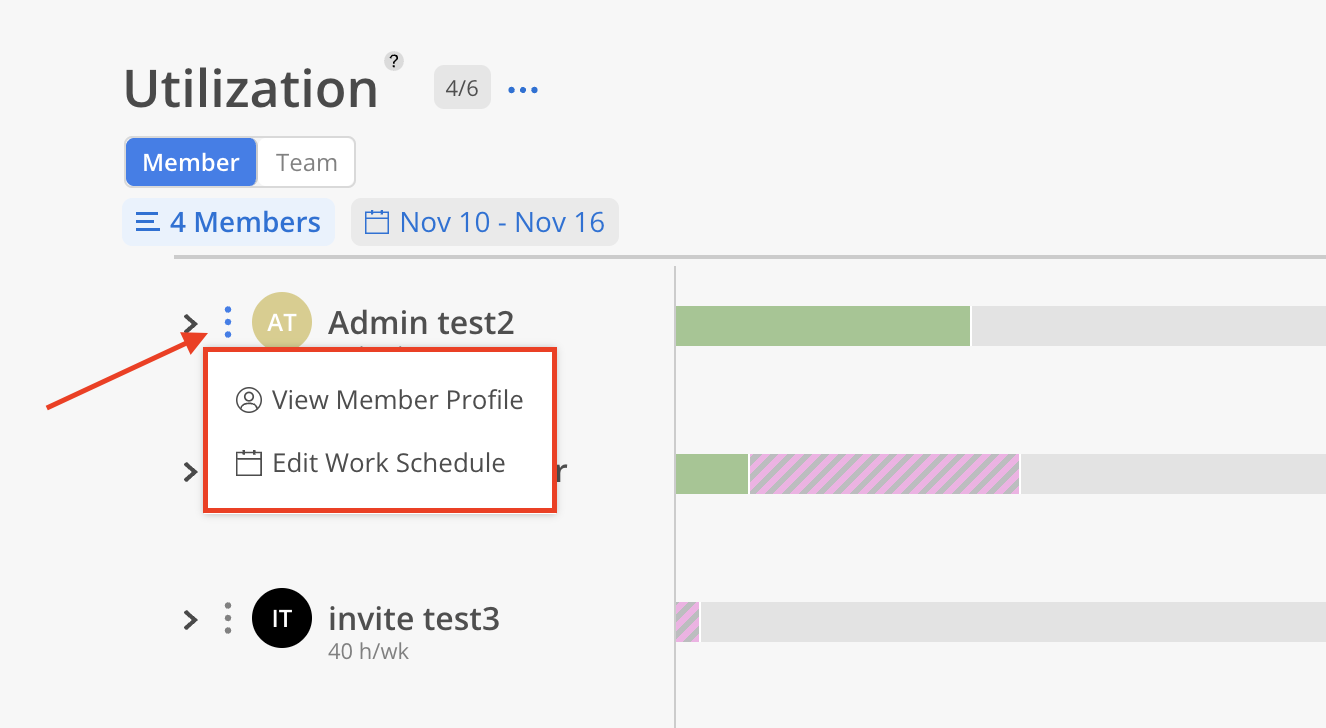
Click the three dots to View Member Profile or Edit Work Schedule.
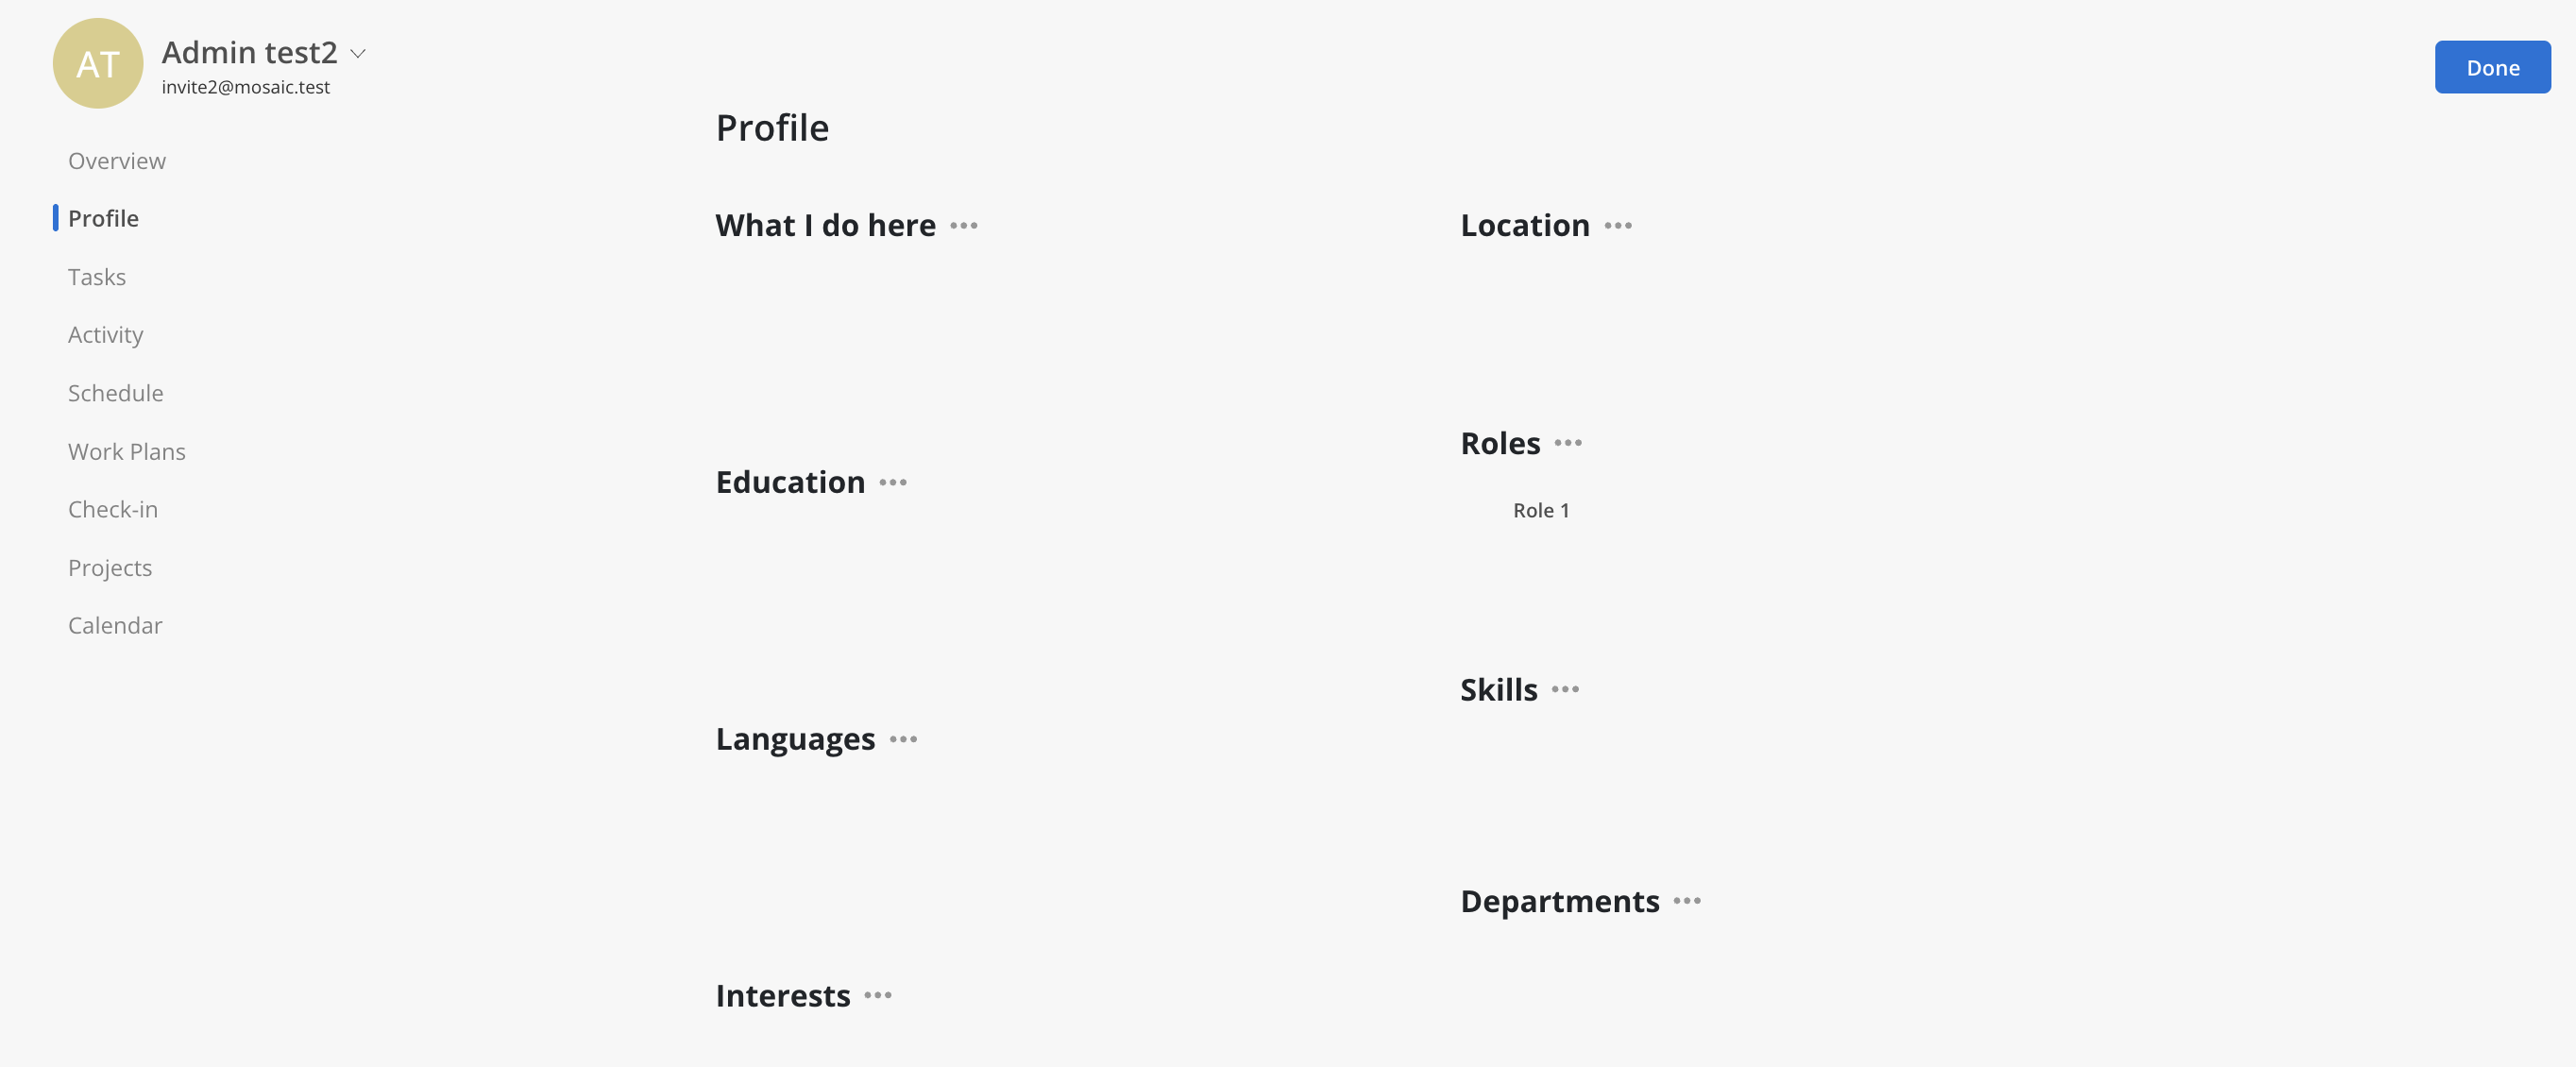
View Member Profile button opens Member Modal to profile page, which includes the member's work description, education, interests, regions, disciplines and so on.
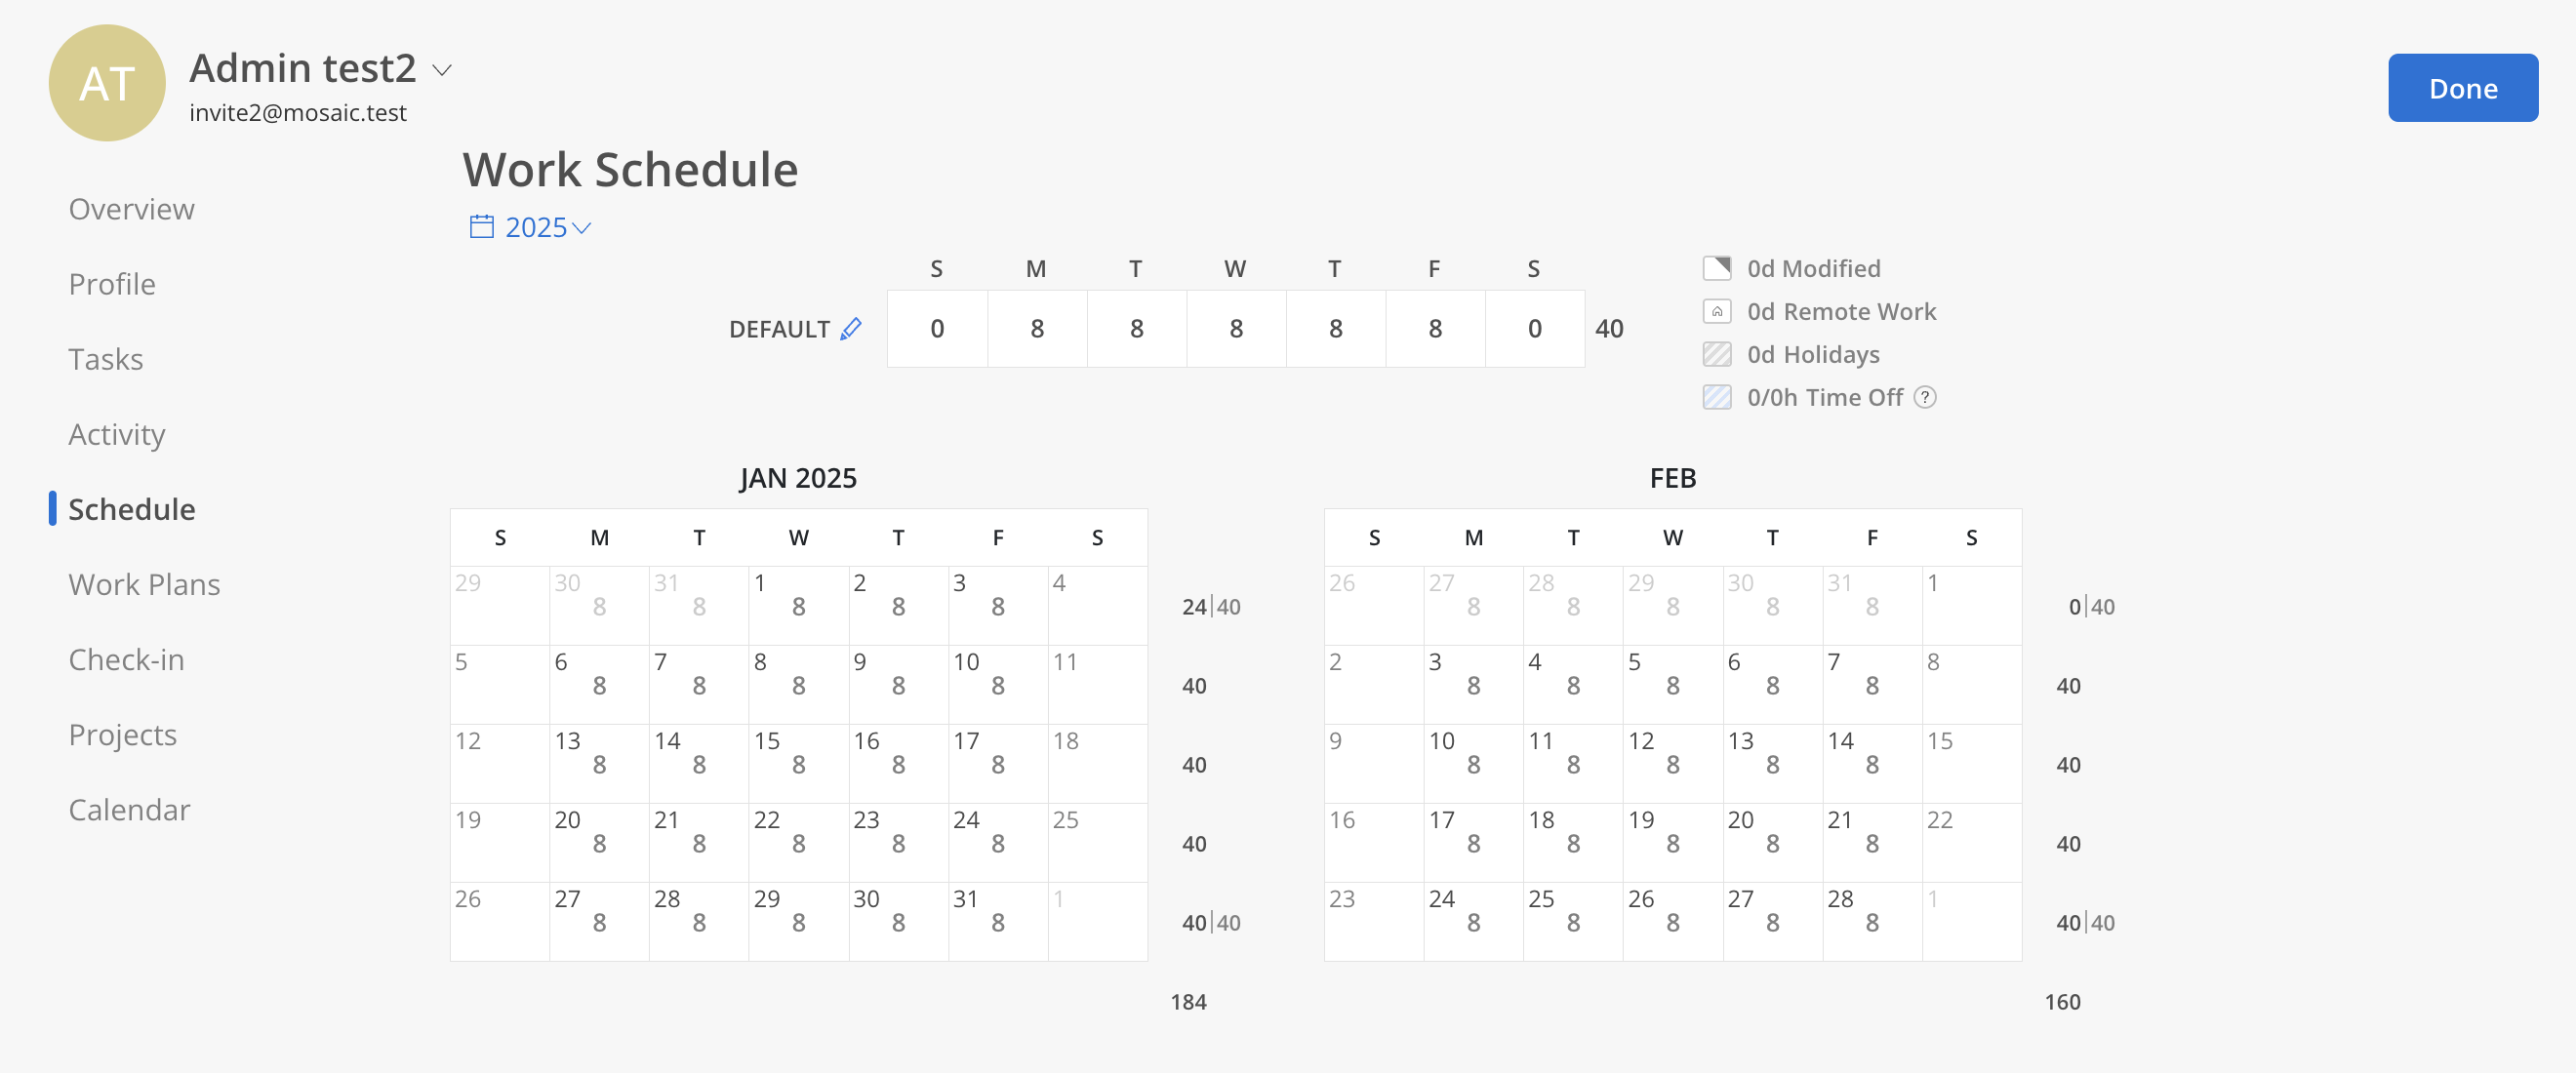
View Member Profile button opens Member Modal to Schedule page, which you can view the member's capacity and calendar of TO and holidays. Only Admins are able to edit the capacity of the member.
Work Planners with the following permissions:
Work Planner > Can Edit > Projects they are a Member of
Work Planner > Can Edit > Projects they are a Project Manager of
can only view projects and Members in the hour view and only for the projects they have access to (either as a Member or as a Project Manager).

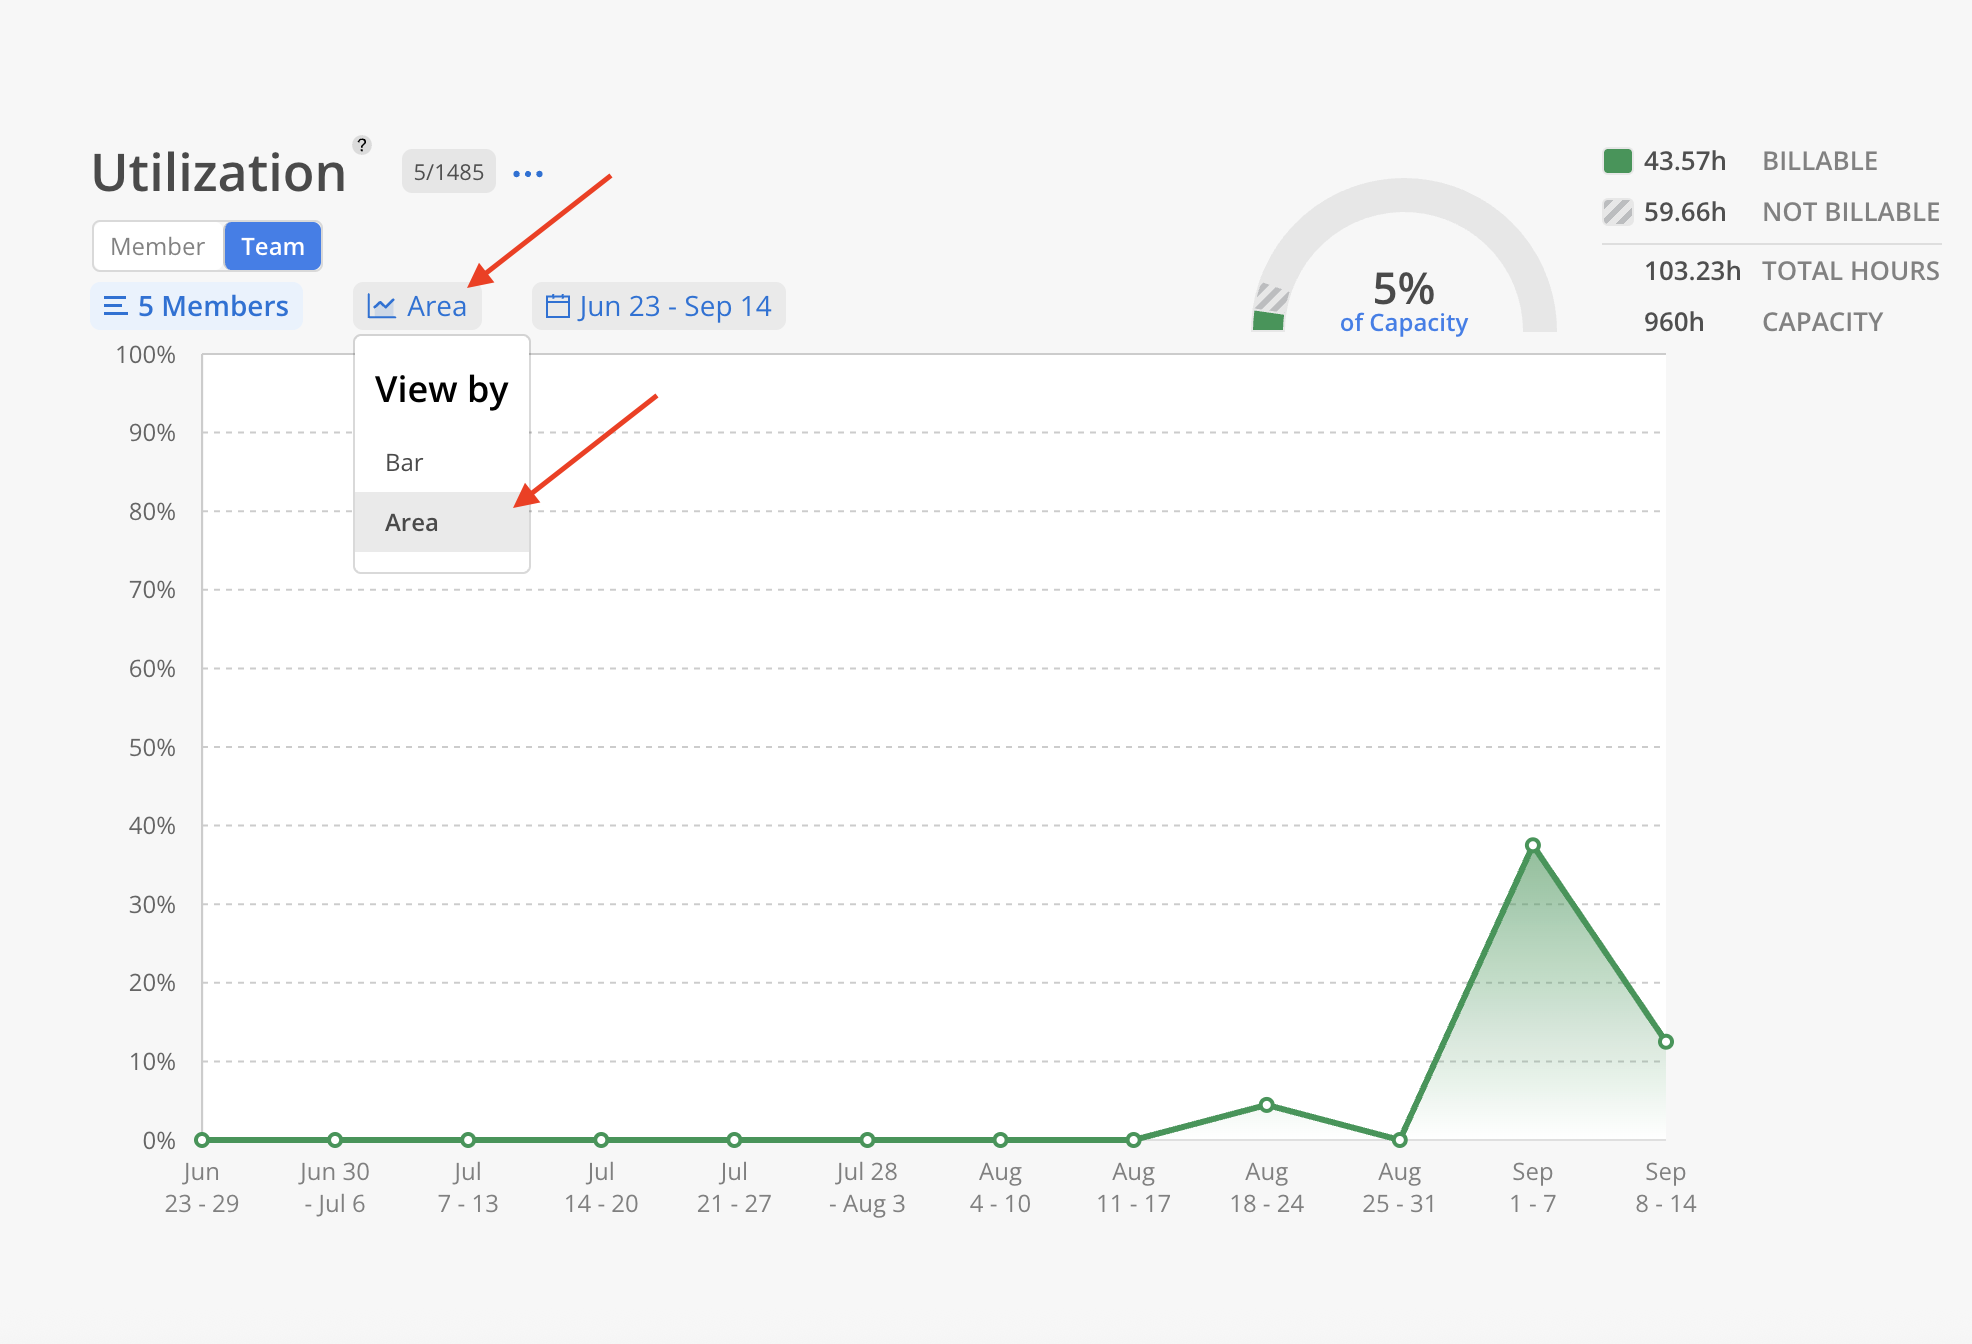
Switch to the Team view to see time entry totals across multiple Members displayed in either a bar chart or area chart, depending on the selected view.
In the bar chart view, each bar represents a week, showing the breakdown of Billable, Not Billable, and Not Entered hours as a percentage of total Capacity.
X-Axis: Weekly time periods
Y-Axis: Utilization as a percentage of Capacity (0%–100%)
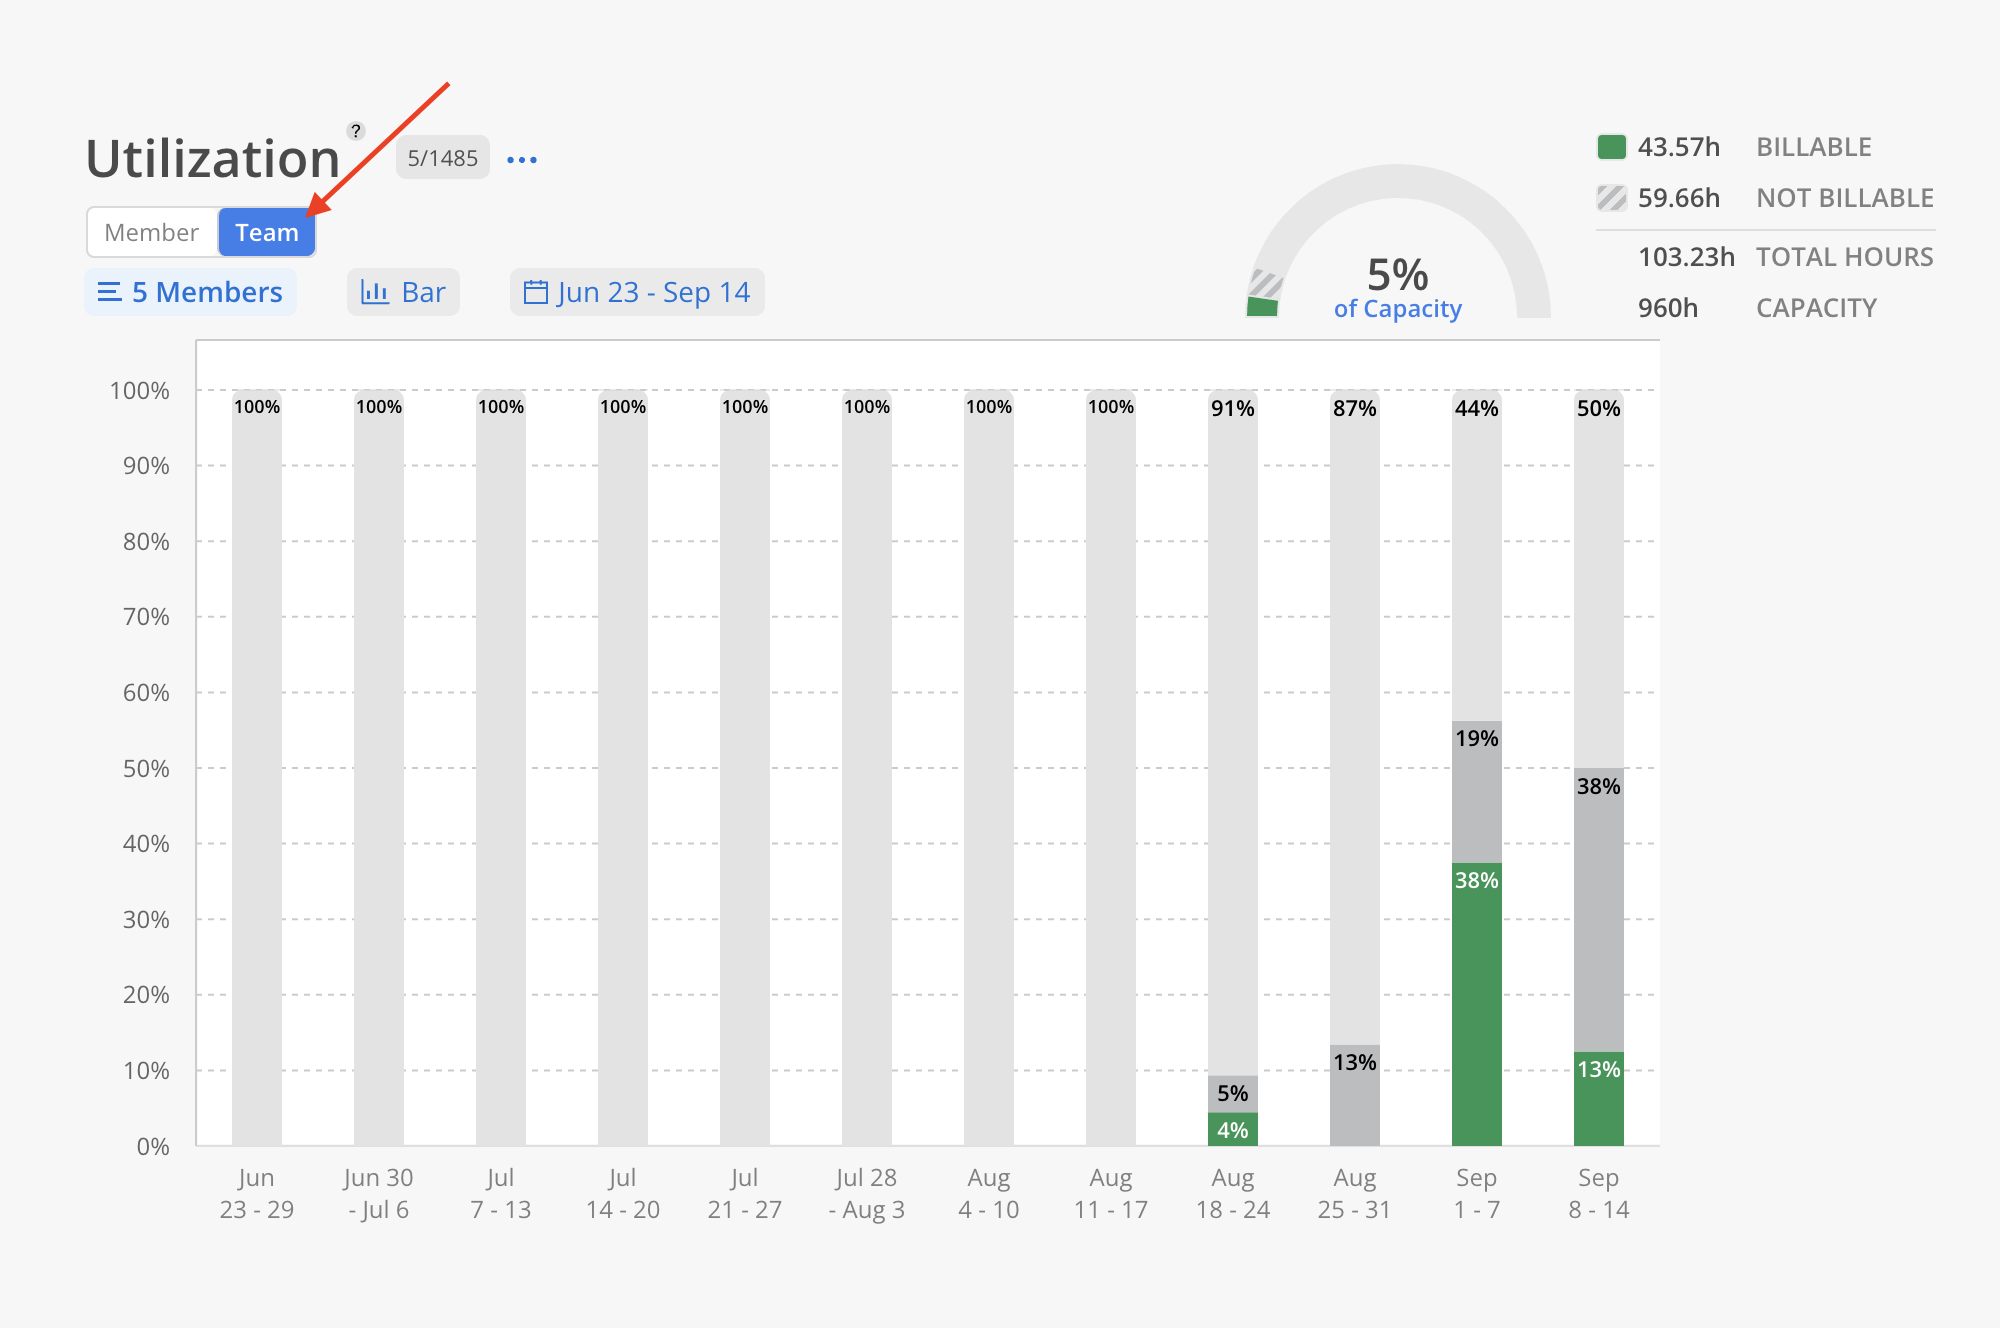
Hovering over a bar displays detailed hour totals and corresponding percentages for the selected week, including the hours and percentages for Billable Hours, Non-Billable Hours, Not Entered Hours, Total Hours, Capacity Hours, and the Utilization Percentage.
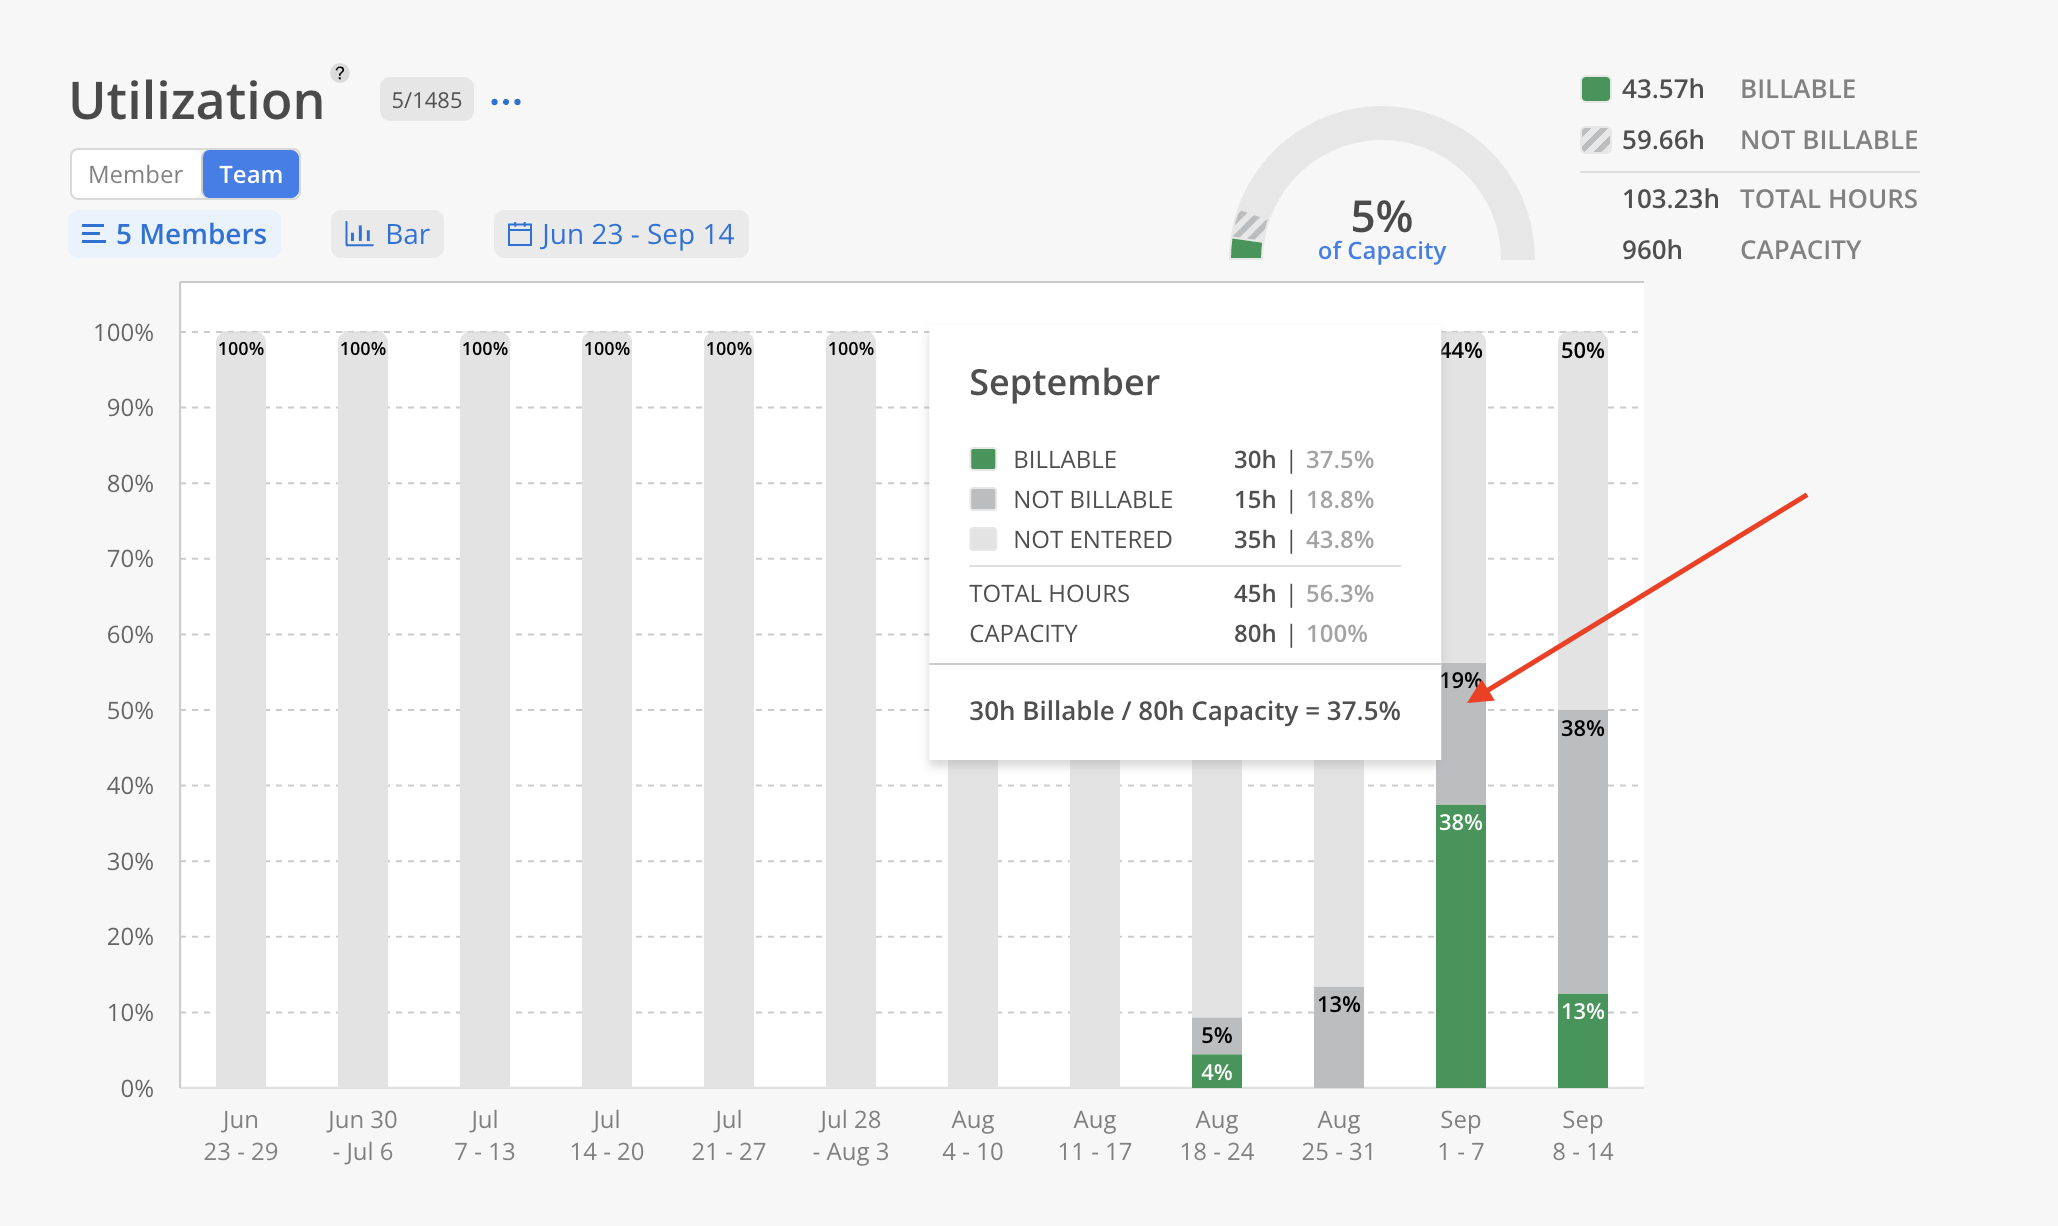
Use the View by toggle to switch between Bar and Area chart formats based on reporting needs.
In the area chart view, utilization is shown as a continuous trend over time.
X-Axis: Weekly time periods
Y-Axis: Percentage of Billable and Non-Billable hours relative to Capacity
The shaded area highlights fluctuations in the utilization percentage over the selected date range.
