The Profit Margins Report offers a visual summary of each project's profitability. Help identify which projects are generating strong returns and which may need closer financial review. All selected Projects and views will be saved automatically in this report.
Click Select Projects to choose which Projects to include in the Profit Margin report.
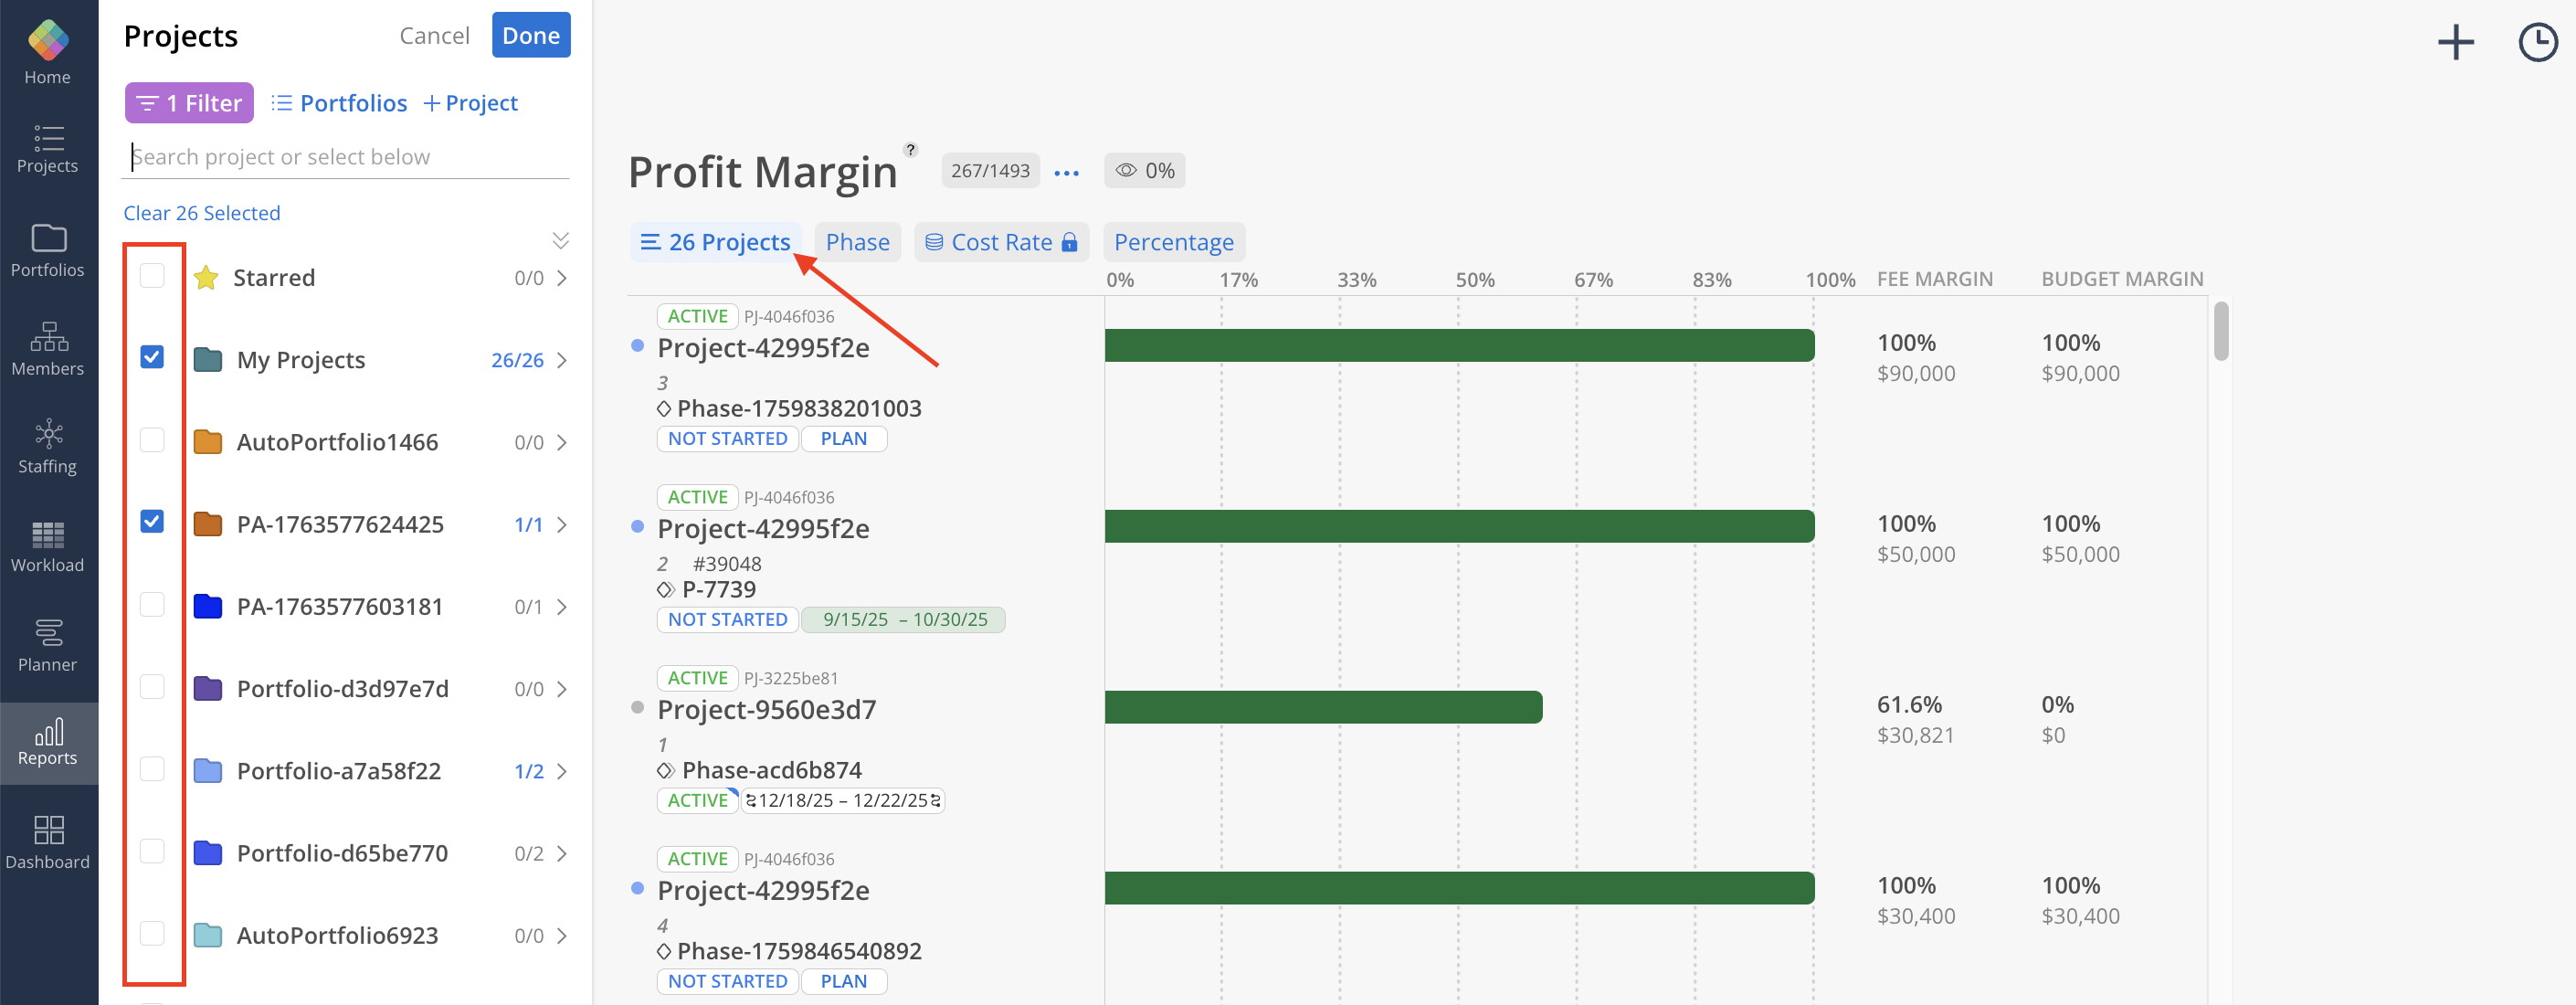
Projects can be grouped by Portfolios, Projects, or Members using the Group By dropdown.
Use the checkbox next to a Portfolio to select all Projects within it, or check individual boxes to select specific Projects for viewing.
Use the Filter option to drill into specific categories of projects.
Once selections are made, click Done to load the report.

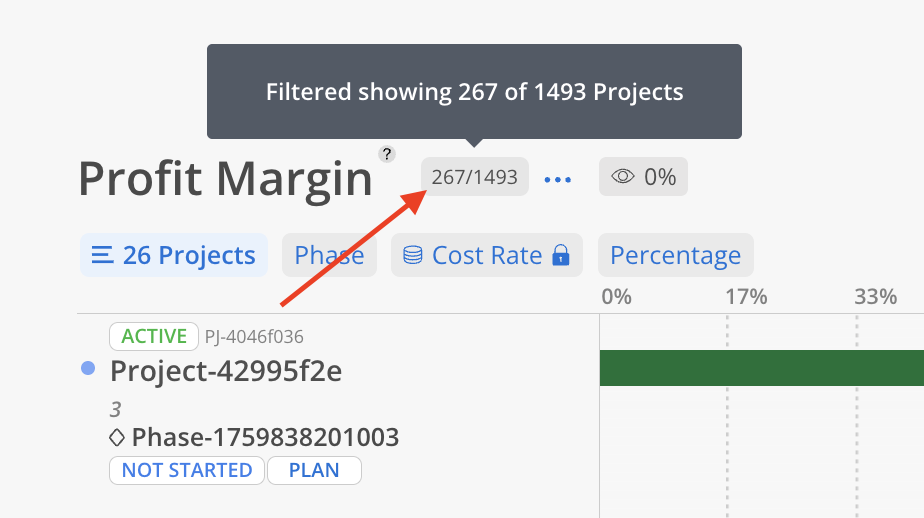
Next to the Report title, the number of filtered Projects is displayed alongside the total count.
The report display can be customized by:
Group by: Projects or Phases
Rate: View by Bill Rate or Cost Rate
Display as: Currency or Percentage
Show/Hide: Display or hide projects that do not have a set Budget (Budget Profit or Budget Margin equals $0, depending on the selected Rate Option).

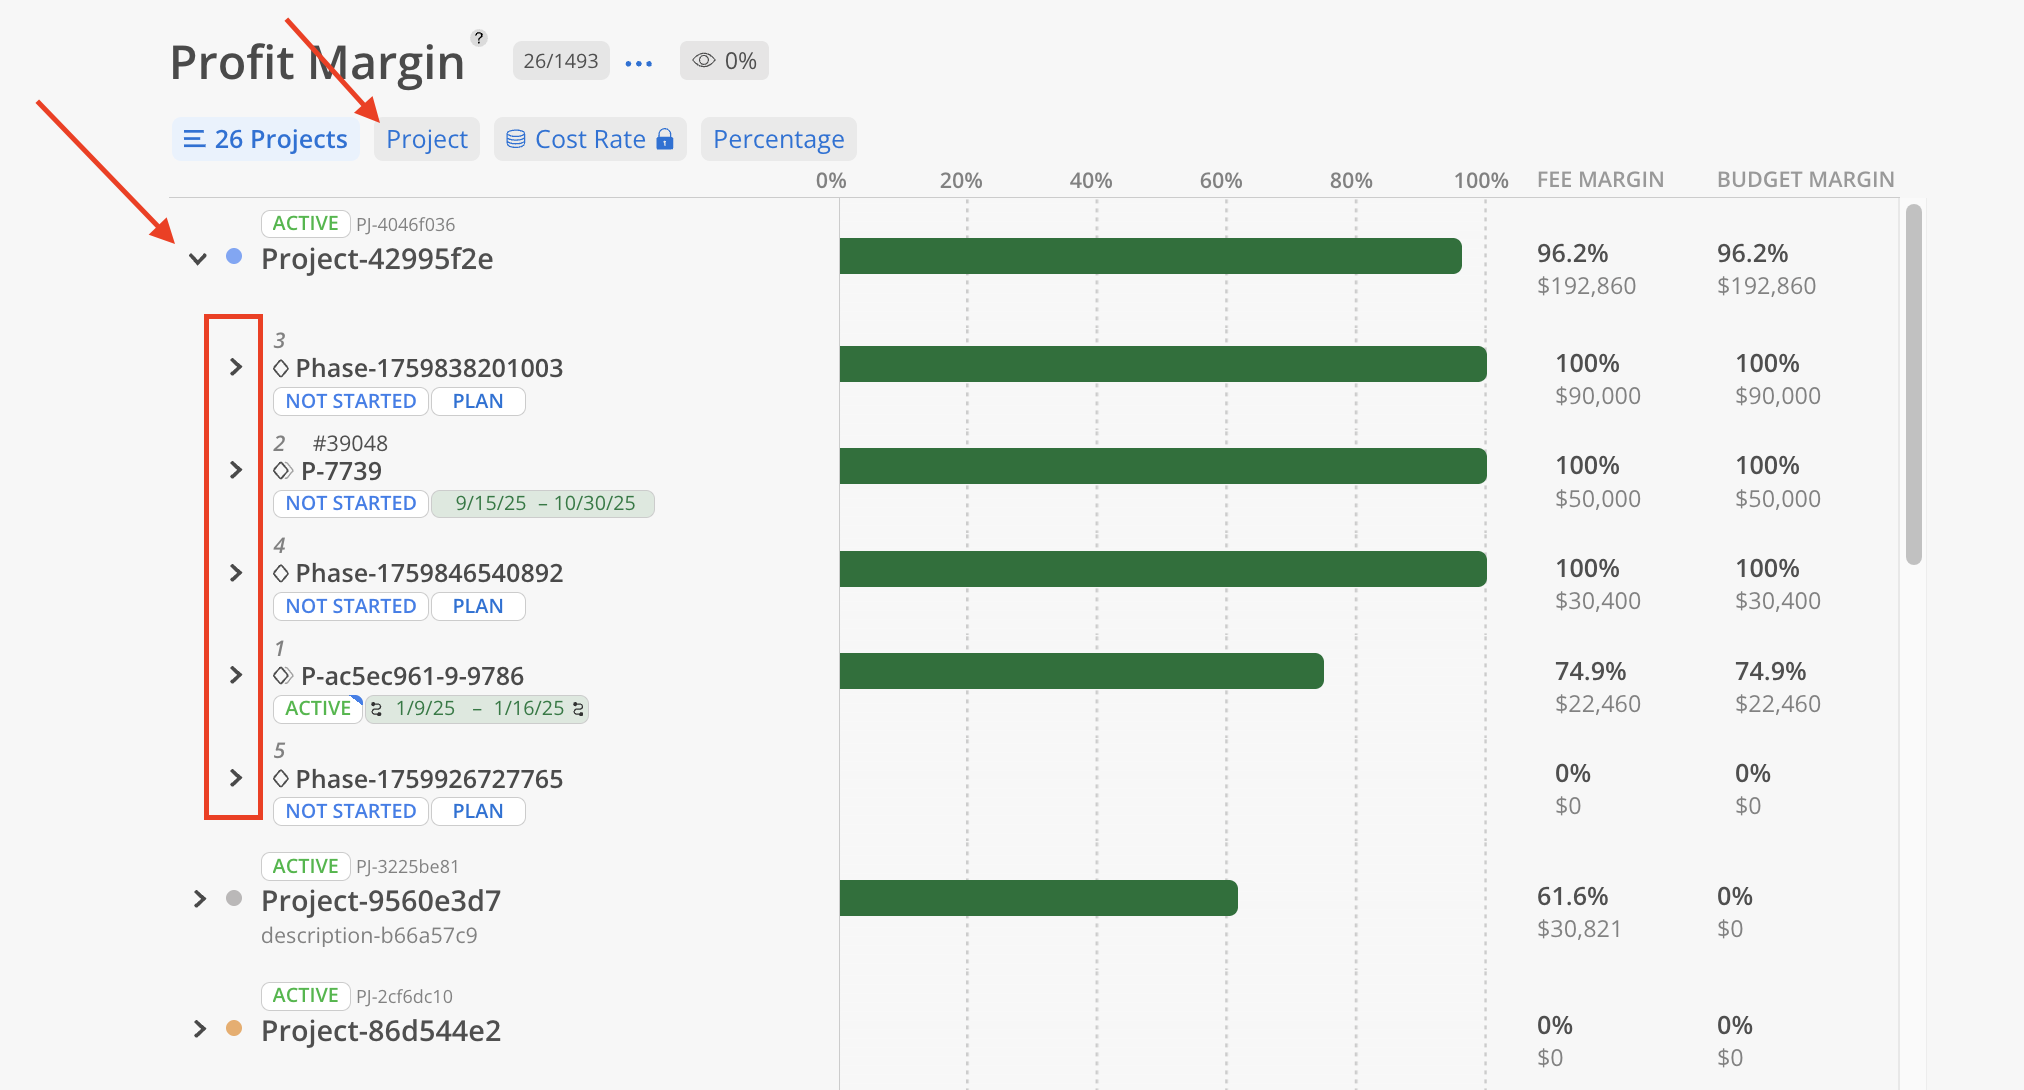
In the Group by Project view, the selected Projects are displayed in descending order based on Fee profit.
Expand a Project reveals a detailed breakdown of profitability by Phases and Subphases, allowing for deeper analysis of where profits are being generated or lost within the Project structure.

Project-level Fee Profit and Budget Profit are calculated by summing the respective profit values across all associated Phases.
Phase-level profit is determined using the following formulas:
Fee Profit = Phase Fee − Amount Spent
Budget Profit = Phase Budget − Amount Spent
Color indicators provide a quick visual assessment of financial status:
A green bar signifies the Project is profitable.
A red bar indicates the Project is operating at a loss.