Open roles created in the Planner or Staffing spaces are visible in the Staffing space, in the Workload space's Open Roles view, in the Planned Time report, and in the Role Demand report. Open roles represent future demand that has not yet been assigned to a person, so they are the first place to look when deciding whether to hire or reassign.
Staffing space — Both Project Finder and Team Builder display open roles
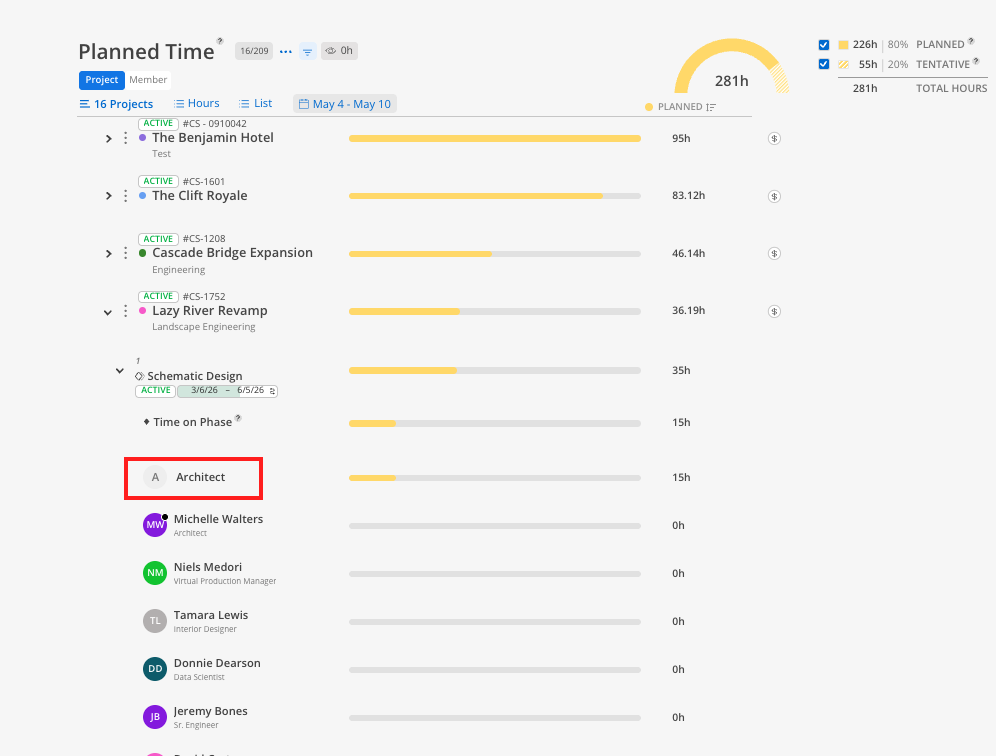
Planned Time report — Shows open roles alongside confirmed members, rolled up to total hours or dollars
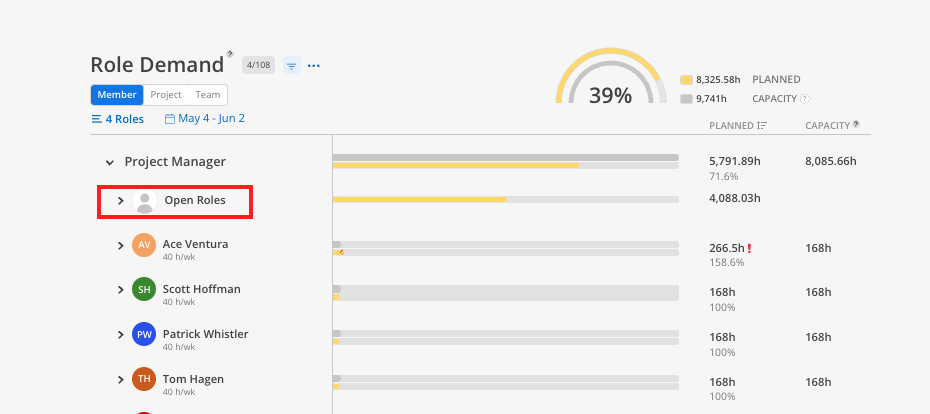
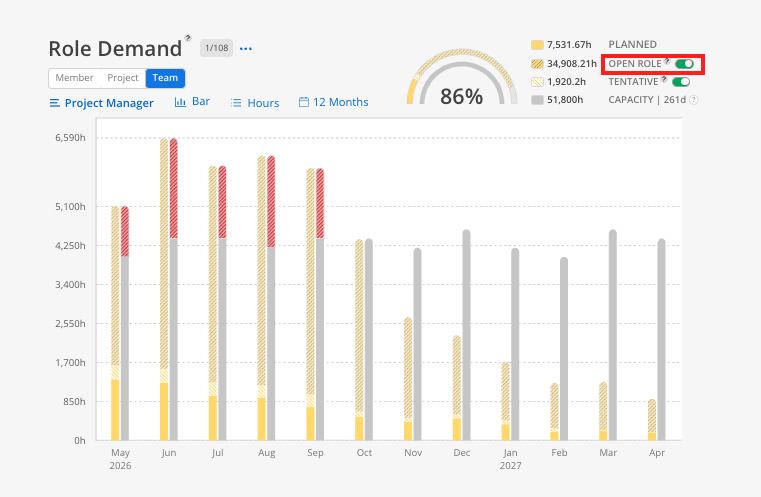
Role Demand report — Shows demand by role type, including both assigned work and open roles. Can be viewed as a list or as a graph comparing total capacity against plan time
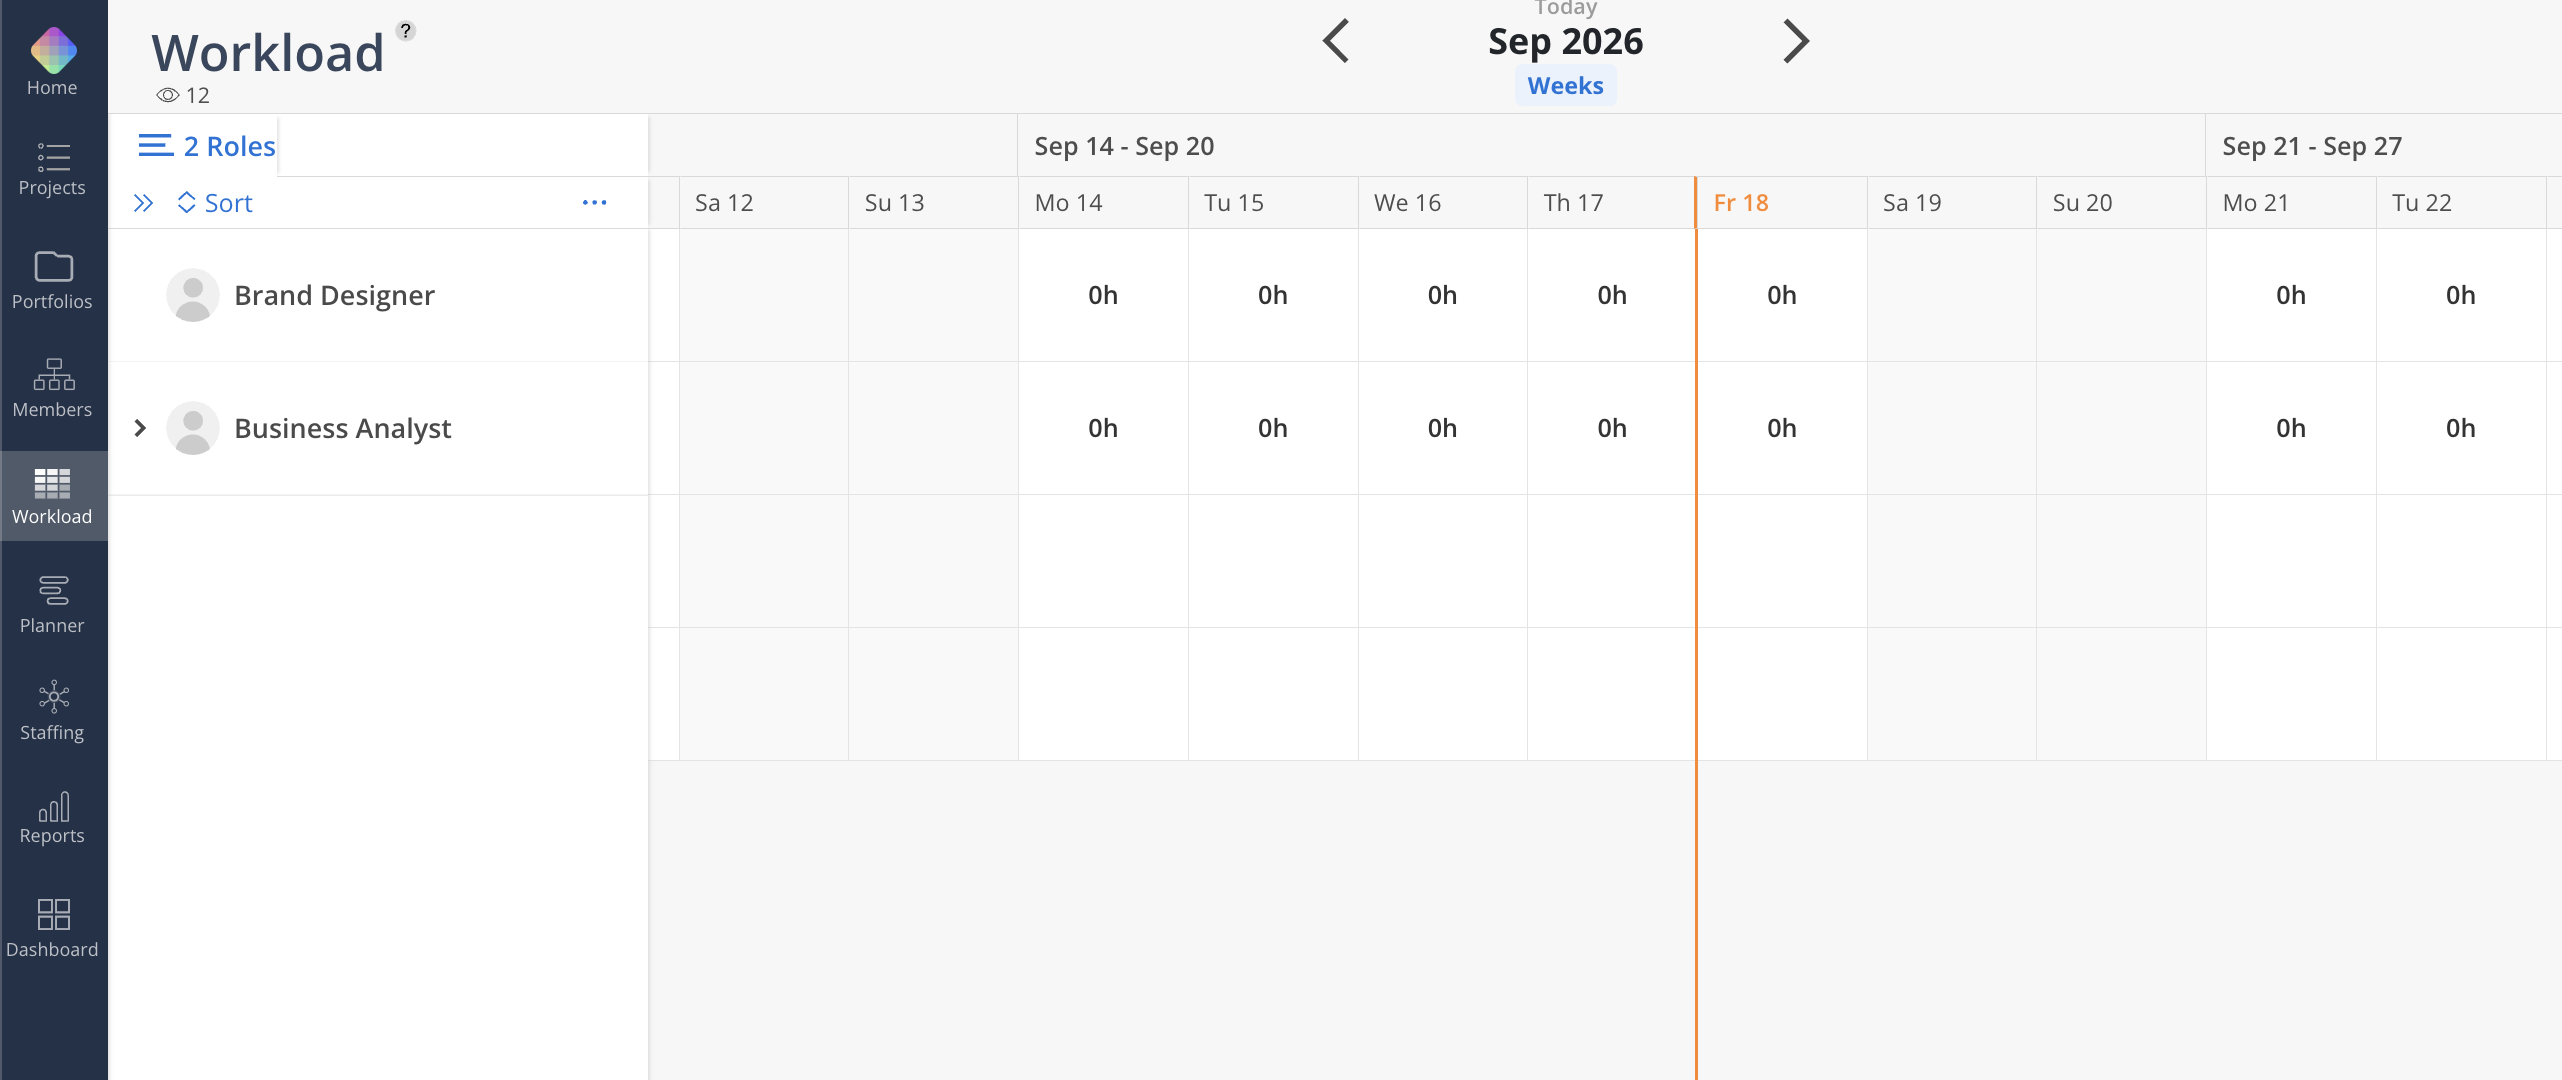
Workload Space groups every open role on your projects by Role, with the projects that need it listed underneath.
The Role Demand report provides an alternative view of open role demand:
Filter by one or more role types to see demand for specific roles
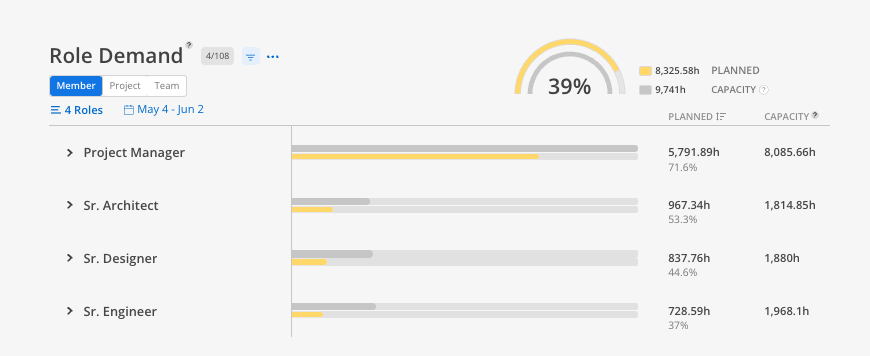
The list view shows individual demand items with the source project indicated
The team view displays a graph with gray bars for total capacity (members and open roles) and colored bars for plan time. Notice there is a Open Roles toggle as in the top-right corner, allowing to quickly see the affect of adding the Open Roles’ time into your Organizations overall capacity.
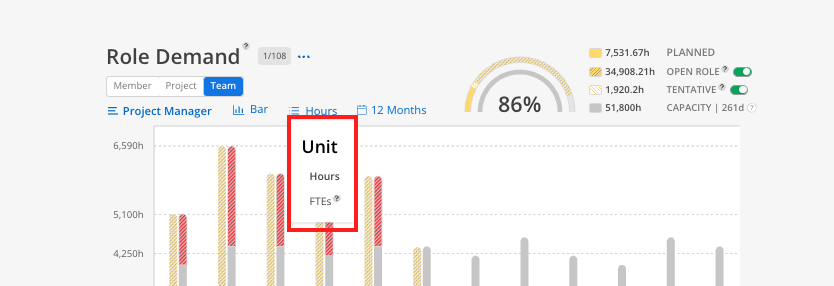
Toggle between full-time equivalent and hours depending on how you prefer to view the data
Use the Planned Time report for a combined view — It shows both confirmed members and open roles in one place, which gives a more complete picture than Workload alone
Check the Role Demand team view for capacity gaps — The graph format makes it easy to spot where planned demand exceeds available capacity
