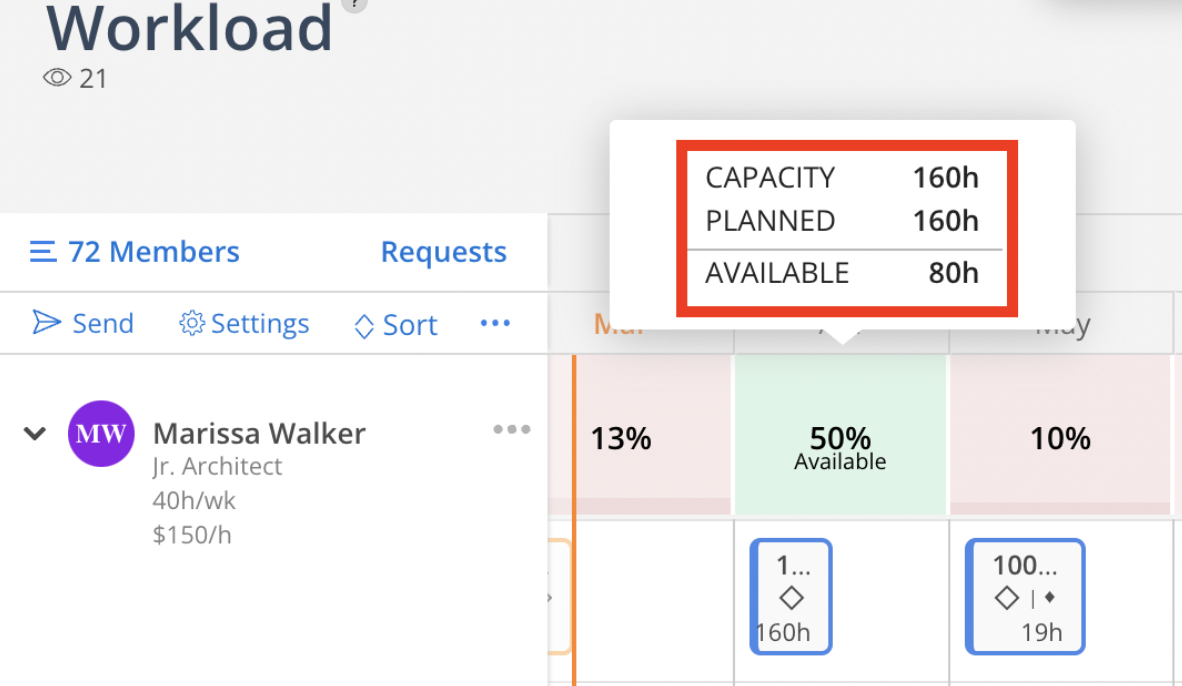
Capacity: The amount of time that may be scheduled in work plans.
Planned: The amount of time that is scheduled in work plans.
Available: The amount of time that is not scheduled in work plans.
The summary row values are calculated by summing the the member values.
Example:

The summary row overcapacity chip is shown when any member is overcapacity.
When grouped by day, availability is defined as the difference between capacity and planned time.
Availability may be negative if planned time exceeds capacity.
Example:

When grouped by week, availability is the sum of the daily difference of capacity and planned time within that capacity.
Availability will never be negative because planned time is always capped at capacity.
Example:


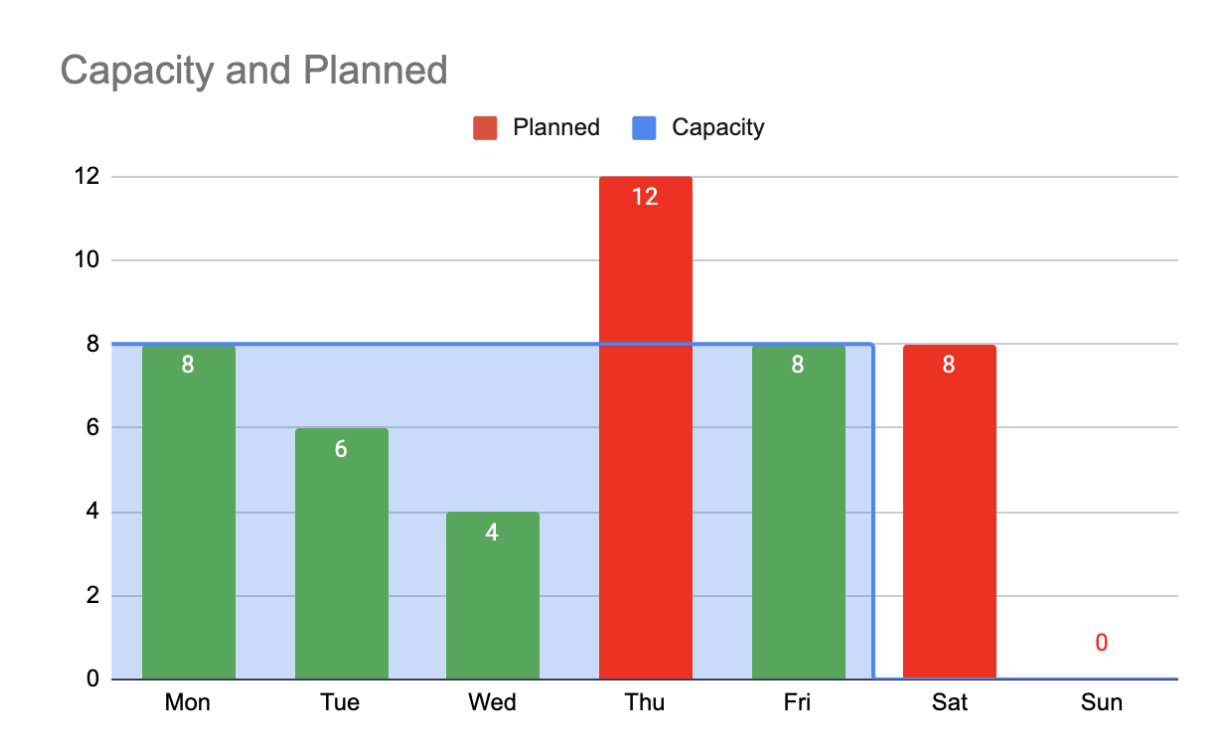
The red over-capacity chip will display on the summary box once a member’s total planned time within a week exceeds the total capacity for that week.
This does not reflect that the member is over capacity every day within that week so there may be available hours still left to plan.
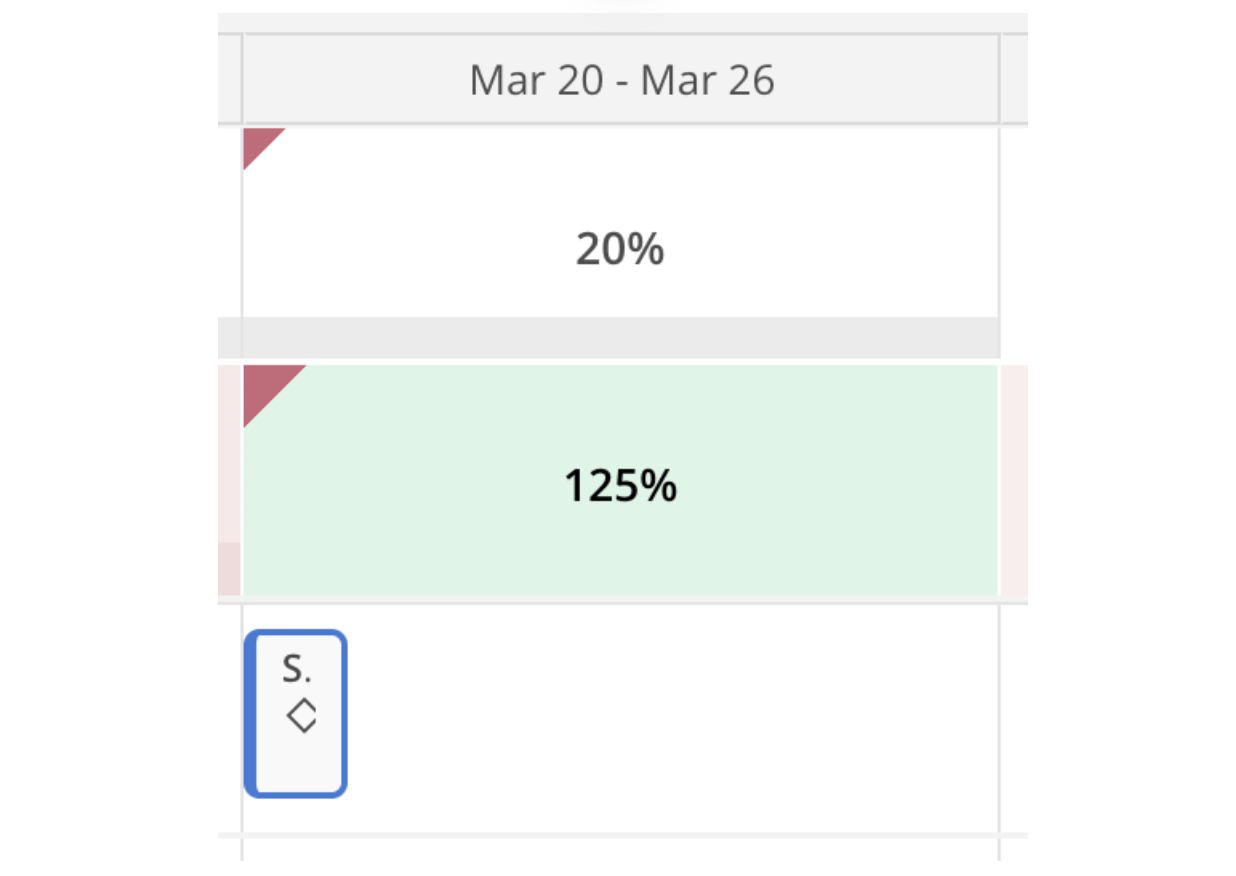
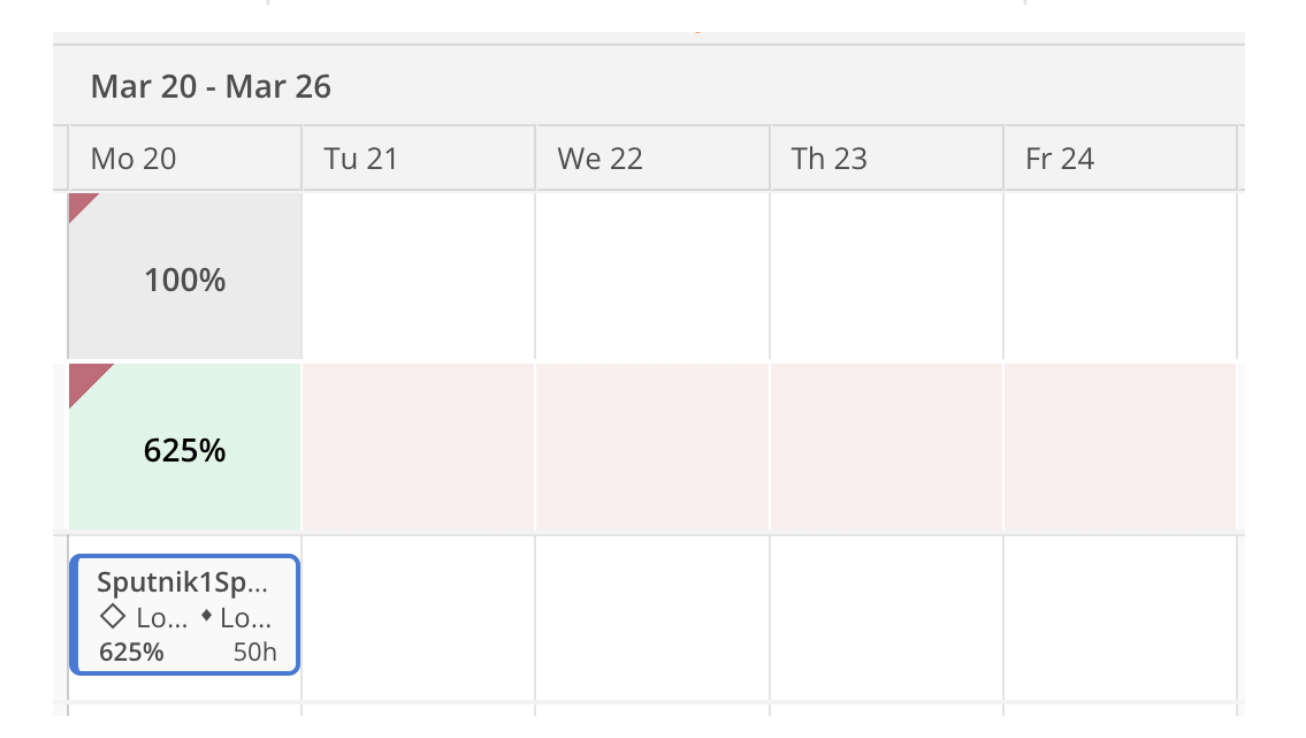
When grouped by month, availability and overcapacity are calculated similarly to the week grouping, but on the basis of an entire month.
Example:
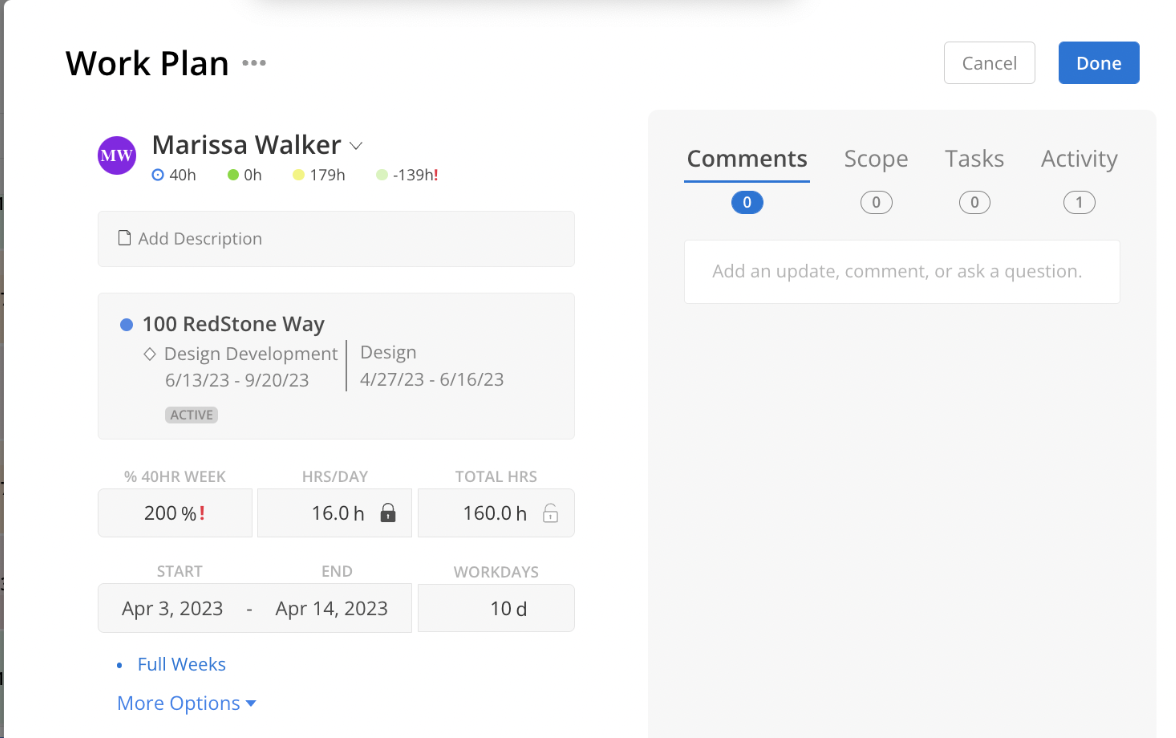
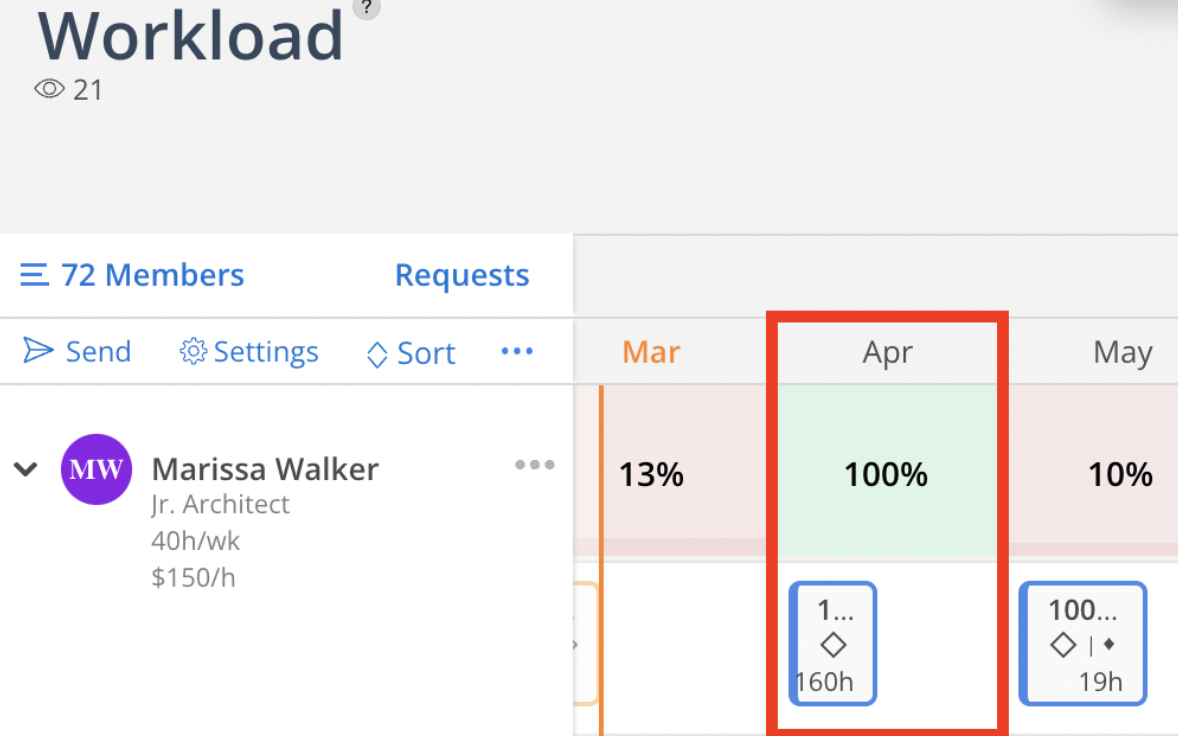
I have a work plan scheduled for the first 2 weeks of April planned at 16 hours per day, totalling 160 hours. Because the total capacity for the month of April is also 160 hours, the summary box shows 100% staffed out. But what about the last two weeks of April? That still has full availability of working hours.
