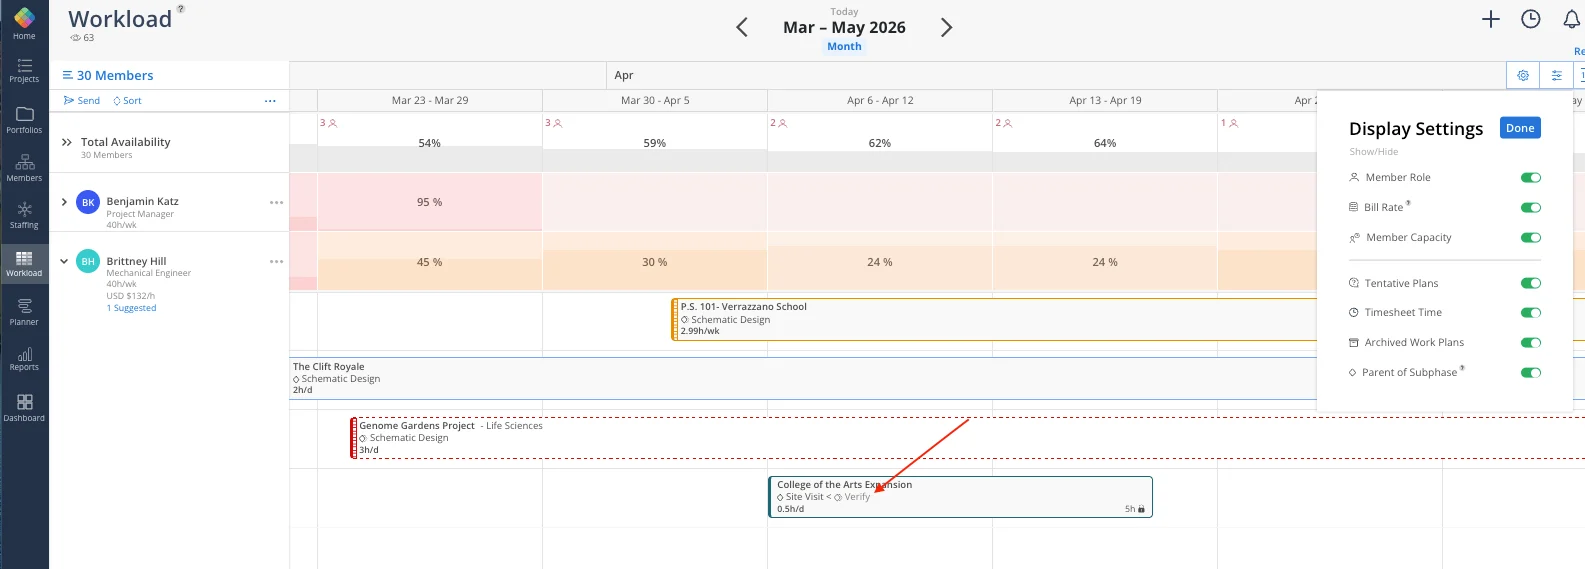
he Display Controls panel brings together all of your workload visibility and planning preferences in one place. To open it, click the Display Controls icon (sliders icon) in the top-right of the Workload space.
Settings are organized into four sections: Members, Schedule, Work Plans, and Workload.
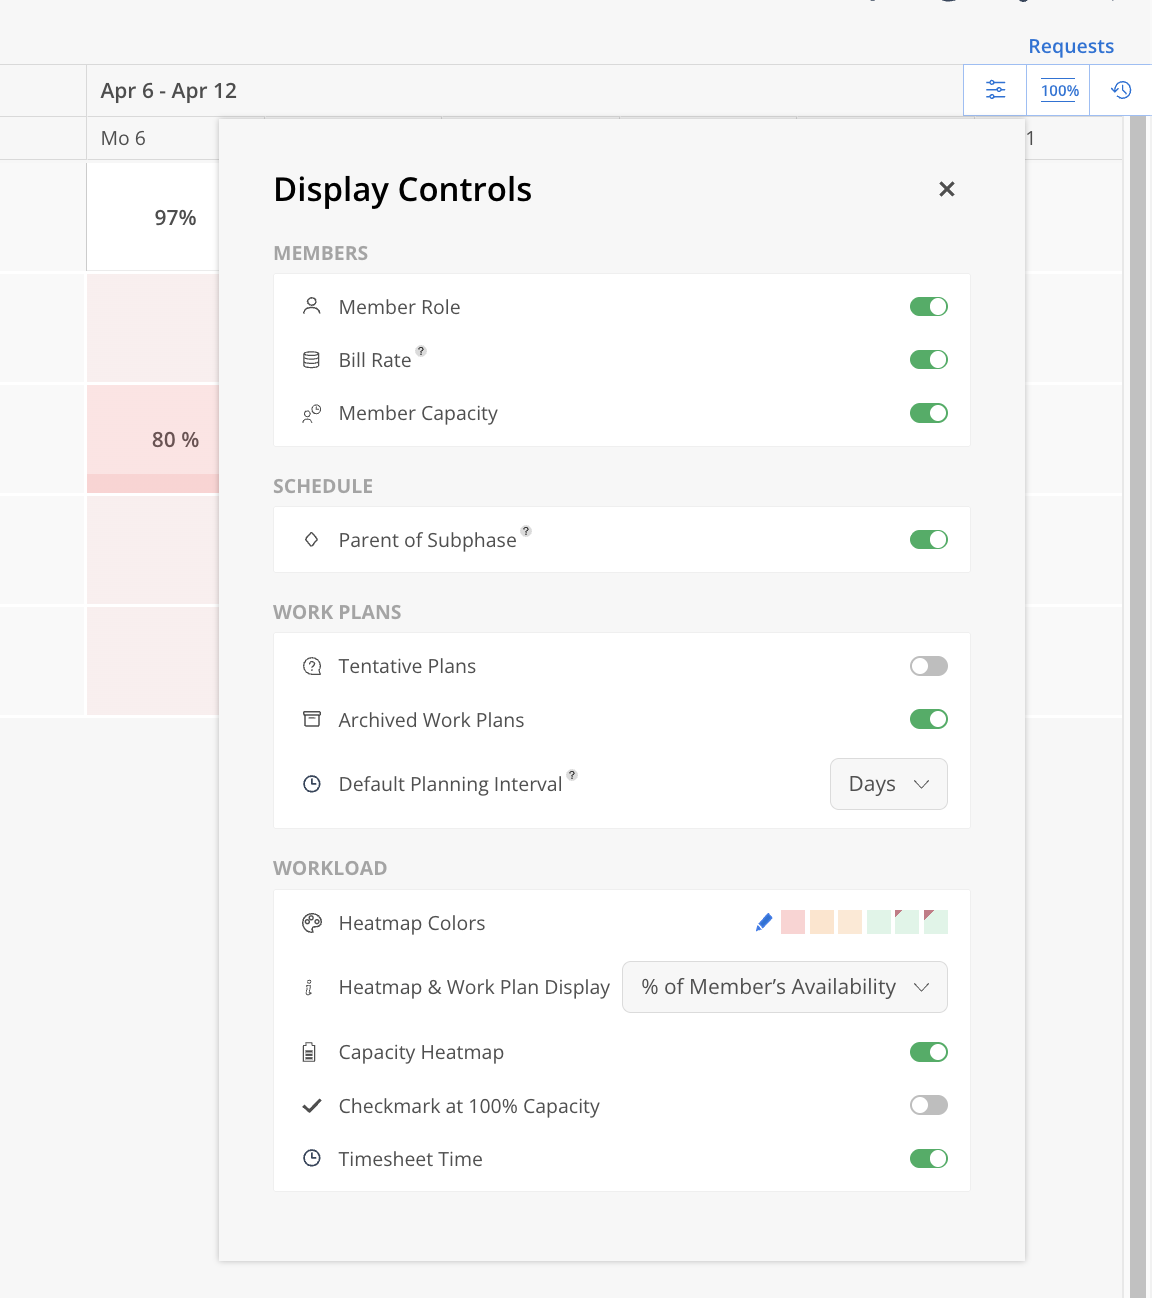
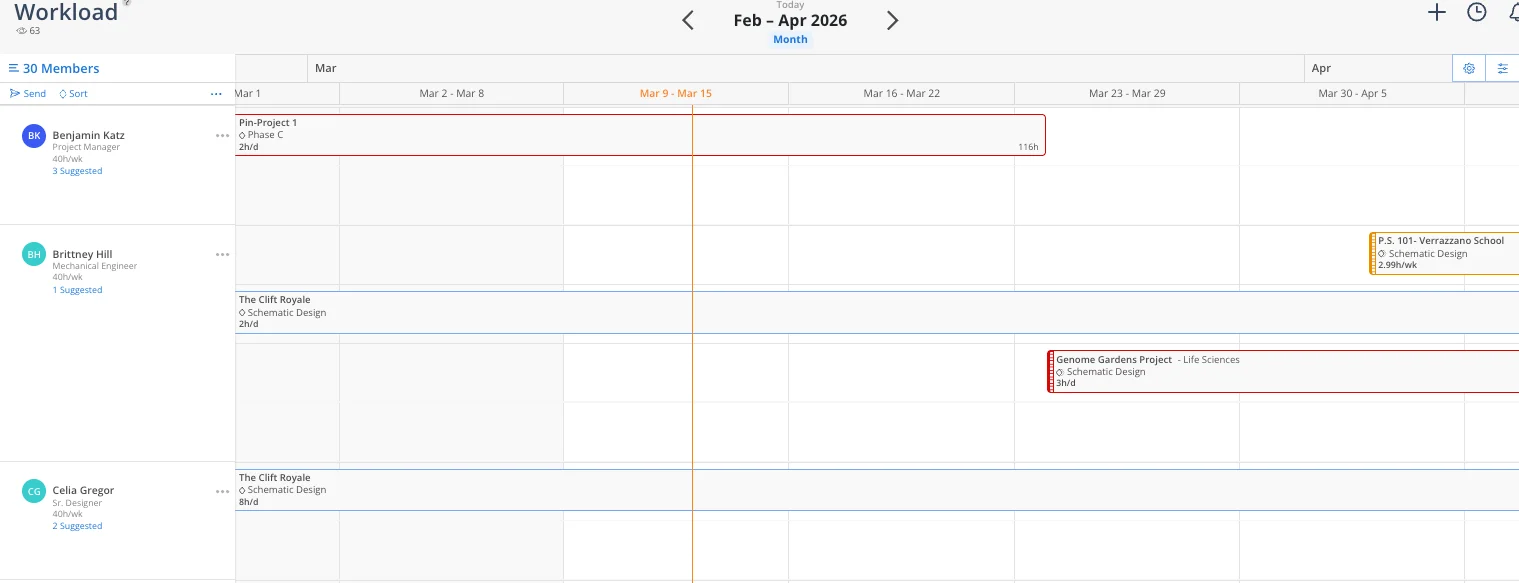
Control what information appears beneath each member's name in the left-side panel.
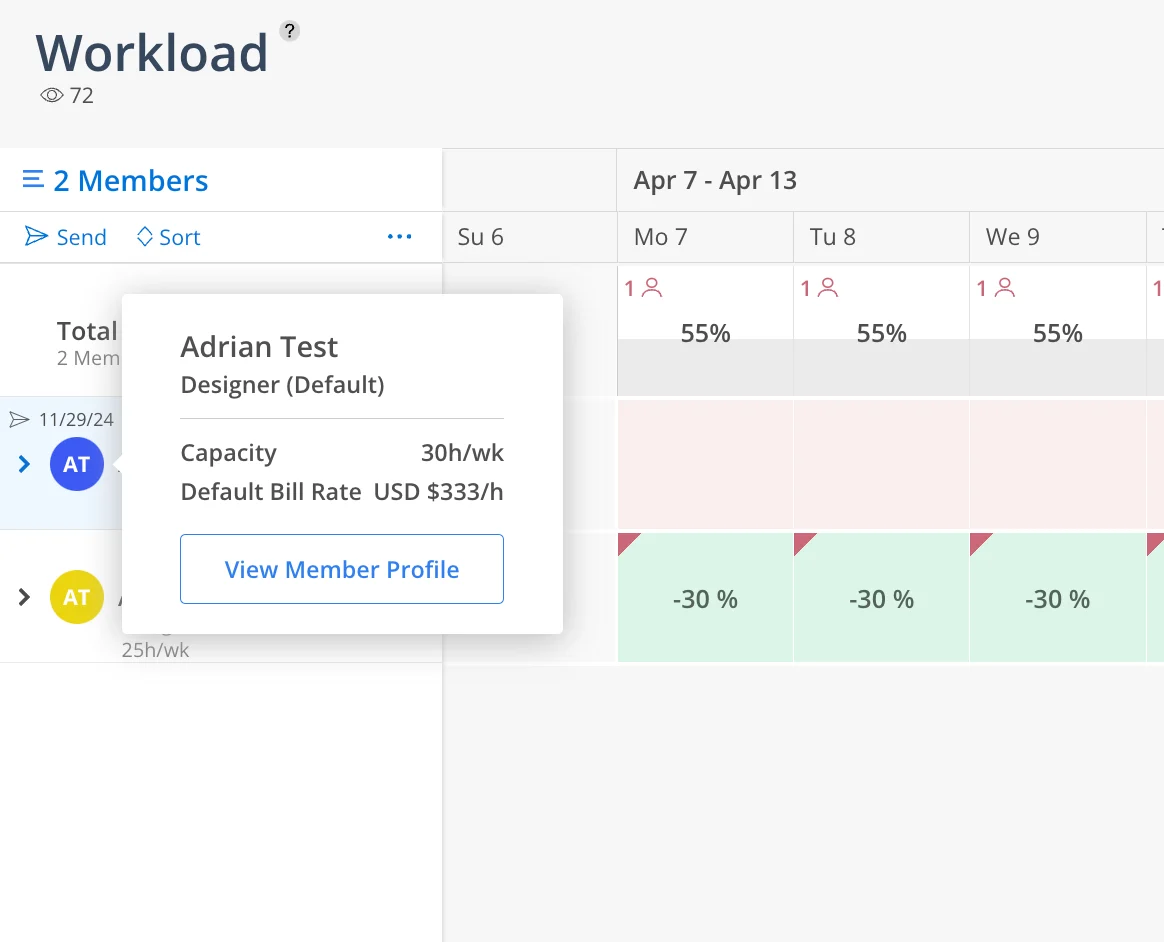
Member Role — Show or hide the member's role.
Bill Rate — Show or hide the member's default bill rate.
Member Capacity — Show or hide the member's default capacity.
Parent of Subphase — When enabled, the parent phase name is shown on a subphase Work Plan bar, making it easier to identify where a subphase belongs at a glance.
Tentative Plans — Show or hide Work Plans that are marked as tentative.
Archived Work Plans — Show or hide archived Work Plans.
Default Planning Interval — Sets whether new Work Plans default to Days or Weeks when scheduling time. Select your preferred interval from the dropdown.
Heatmap Colors — Customize the color theme used for the Capacity Heatmap. Click the pencil icon to edit.
Heatmap & Work Plan Display — Defines the value shown on the heatmap cells and Work Plan bars. Options include:
Planned Hours
Available Hours
% of Member's Capacity
% of Member's Availability
The column header updates to show Total Capacity or Total Availability depending on your selection.
Capacity Heatmap — Toggle the Capacity Heatmap on or off. When disabled, the Workload space shows Work Plan bars only, without the heatmap overlay.
Checkmark at 100% Capacity — When enabled, a checkmark appears on a member's column once they reach 100% capacity for that period.
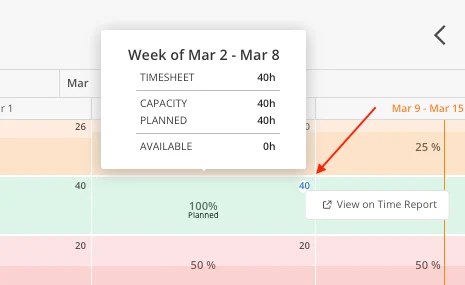
Timesheet Time — Show or hide logged timesheet hours in the top-left corner of a member's capacity cell and in the heatmap tooltip.