See how much time has been planned by Projects, or Members, over any period of time.
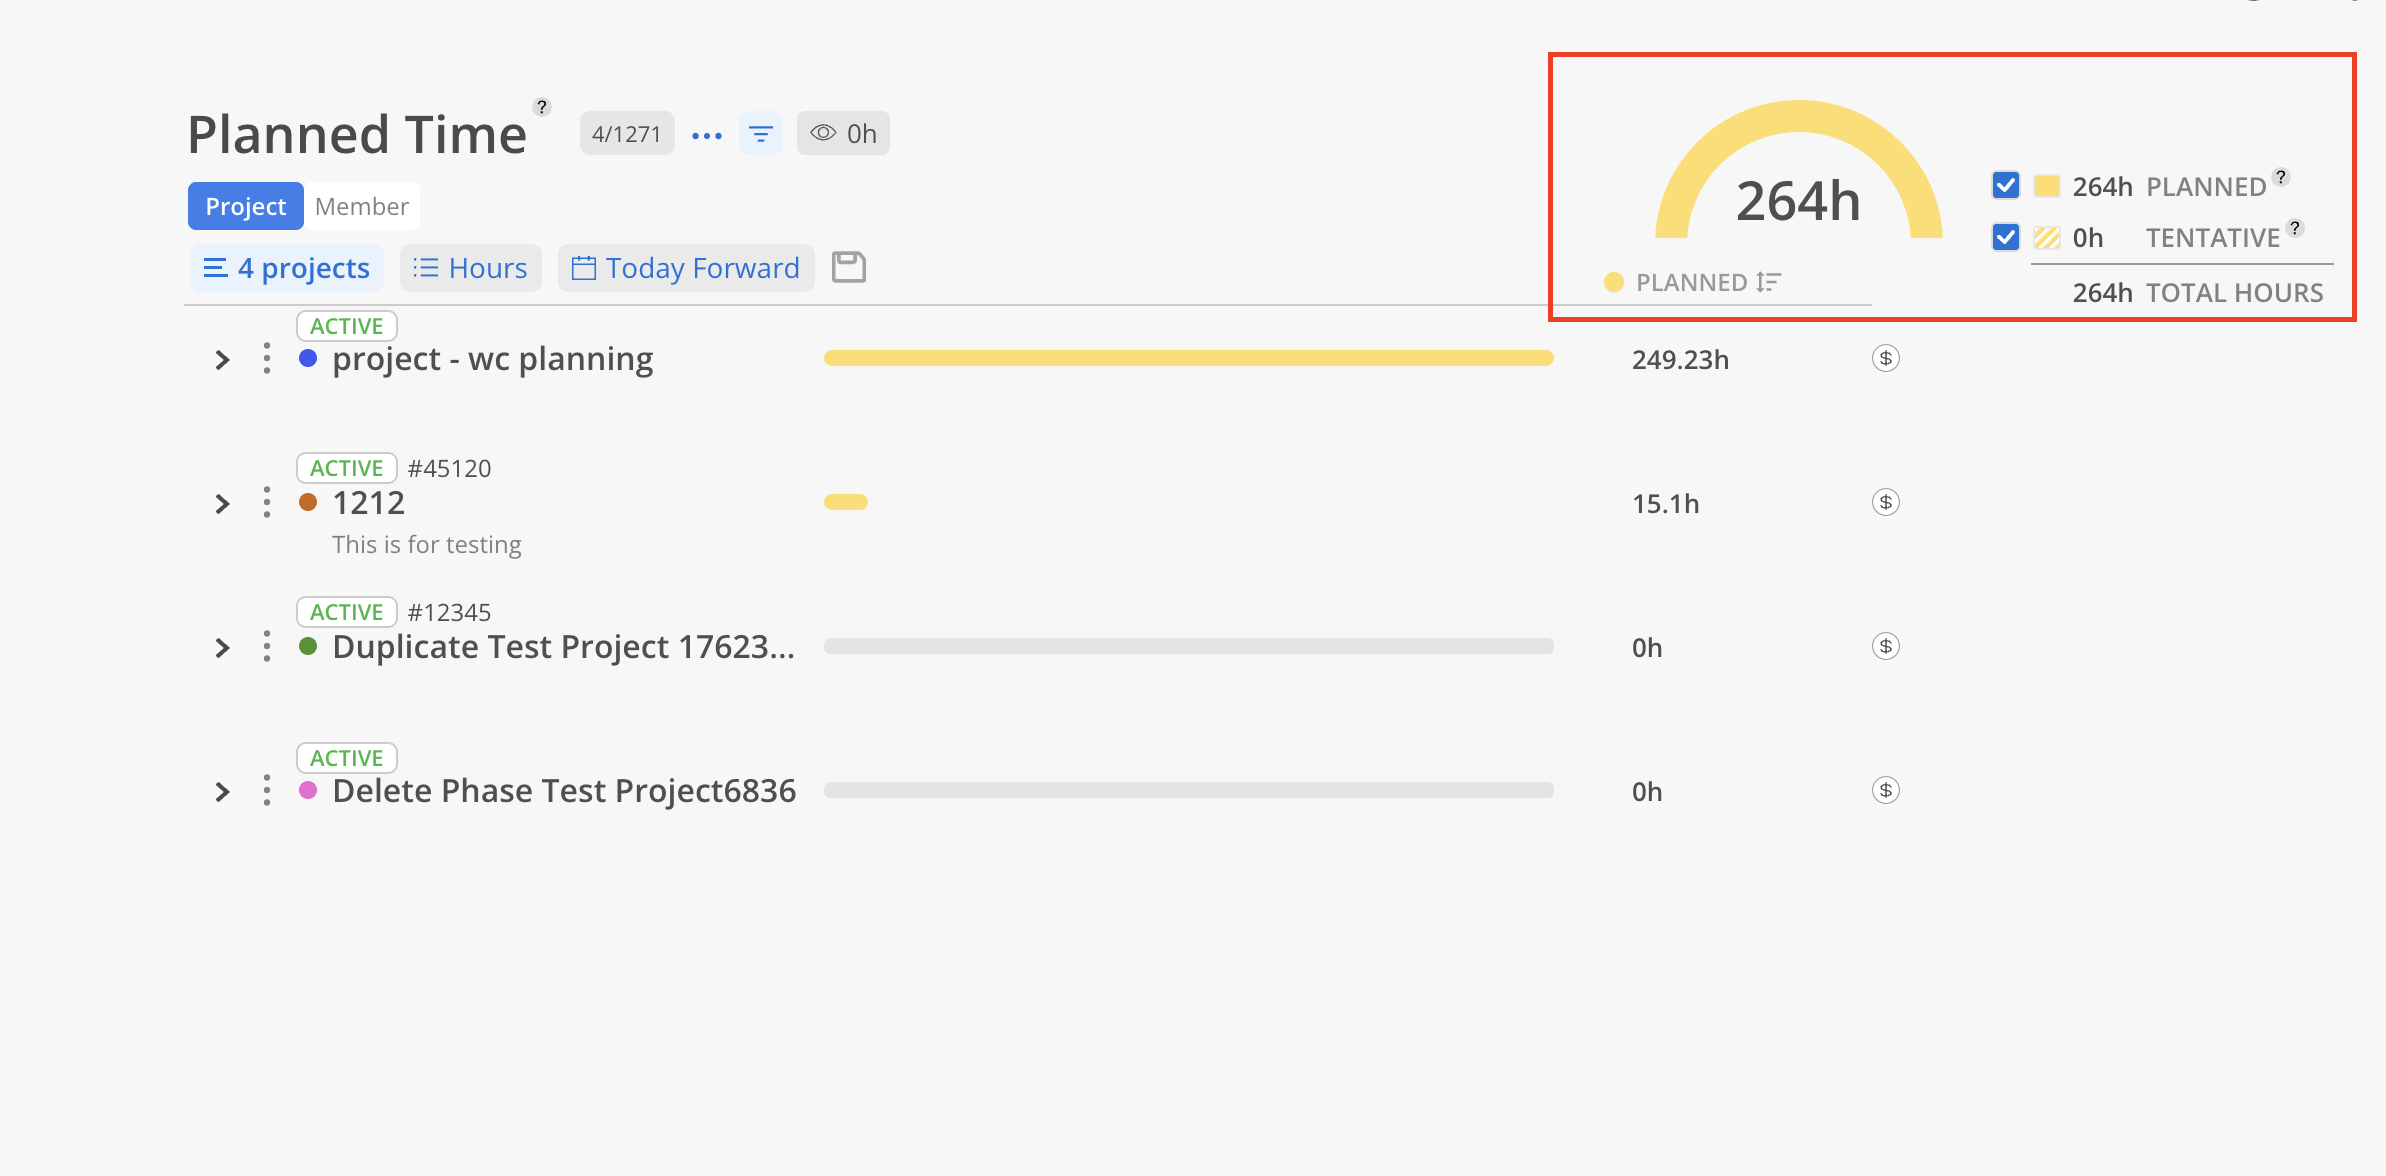
On the top right-hand corner, you will see a summary chart of the total planned hours, as well as a breakdown of work plan hours (orange) and tentative work plan hours (yellow hash).
Click the check box to hide or show hours on both the chart and the report section.
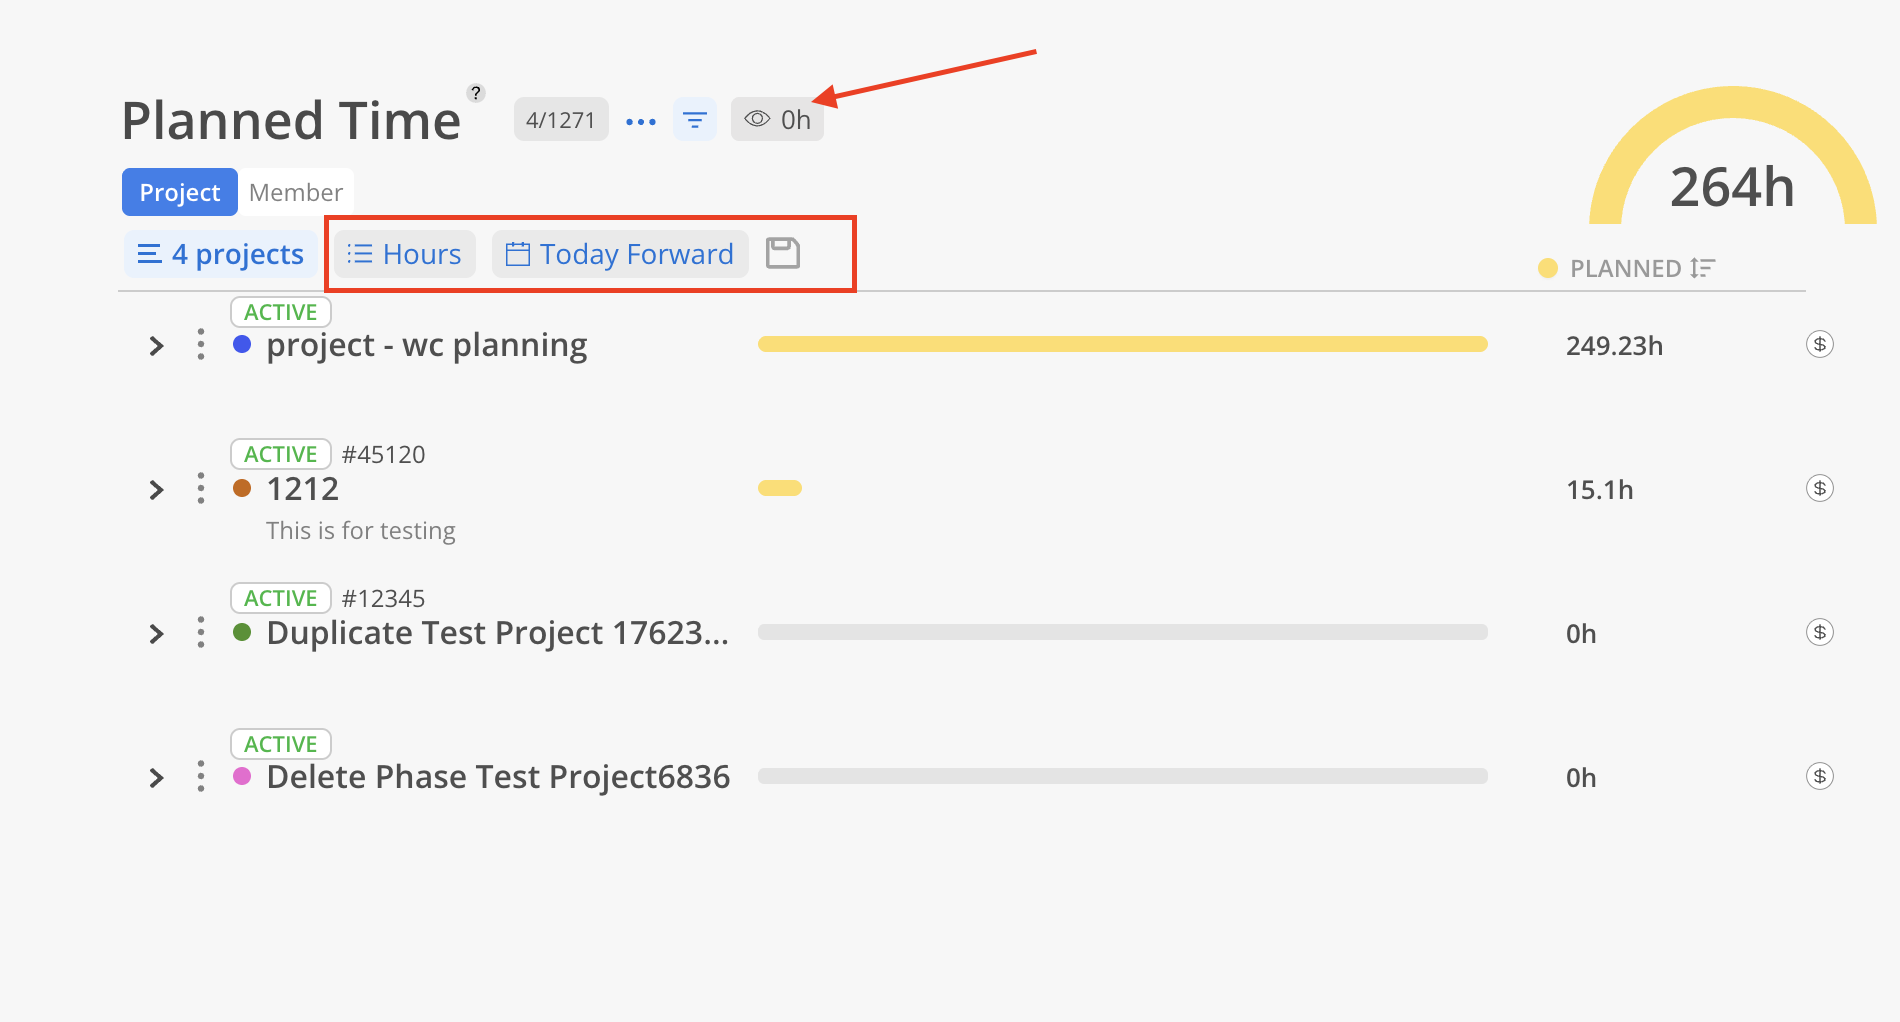
On the top of the page, several options are available for selection:
No Planned (eye icon): Hide Projects that have no planned hours. In the Currency view, a Member has no Rate will be excluded from the report totals—even if they have Planned Hours.
Select Projects to view
Switch between Currency or Hours view.
Select to view currency by Bill Rate or Cost Rate, with access to the Cost Rate view depending on appropriate permission settings.
Time Period to view: From Today, This Week, Next Week, Next 30 Days, Next 3 Months, All Time or Custom
Save: Save the filters for next time.
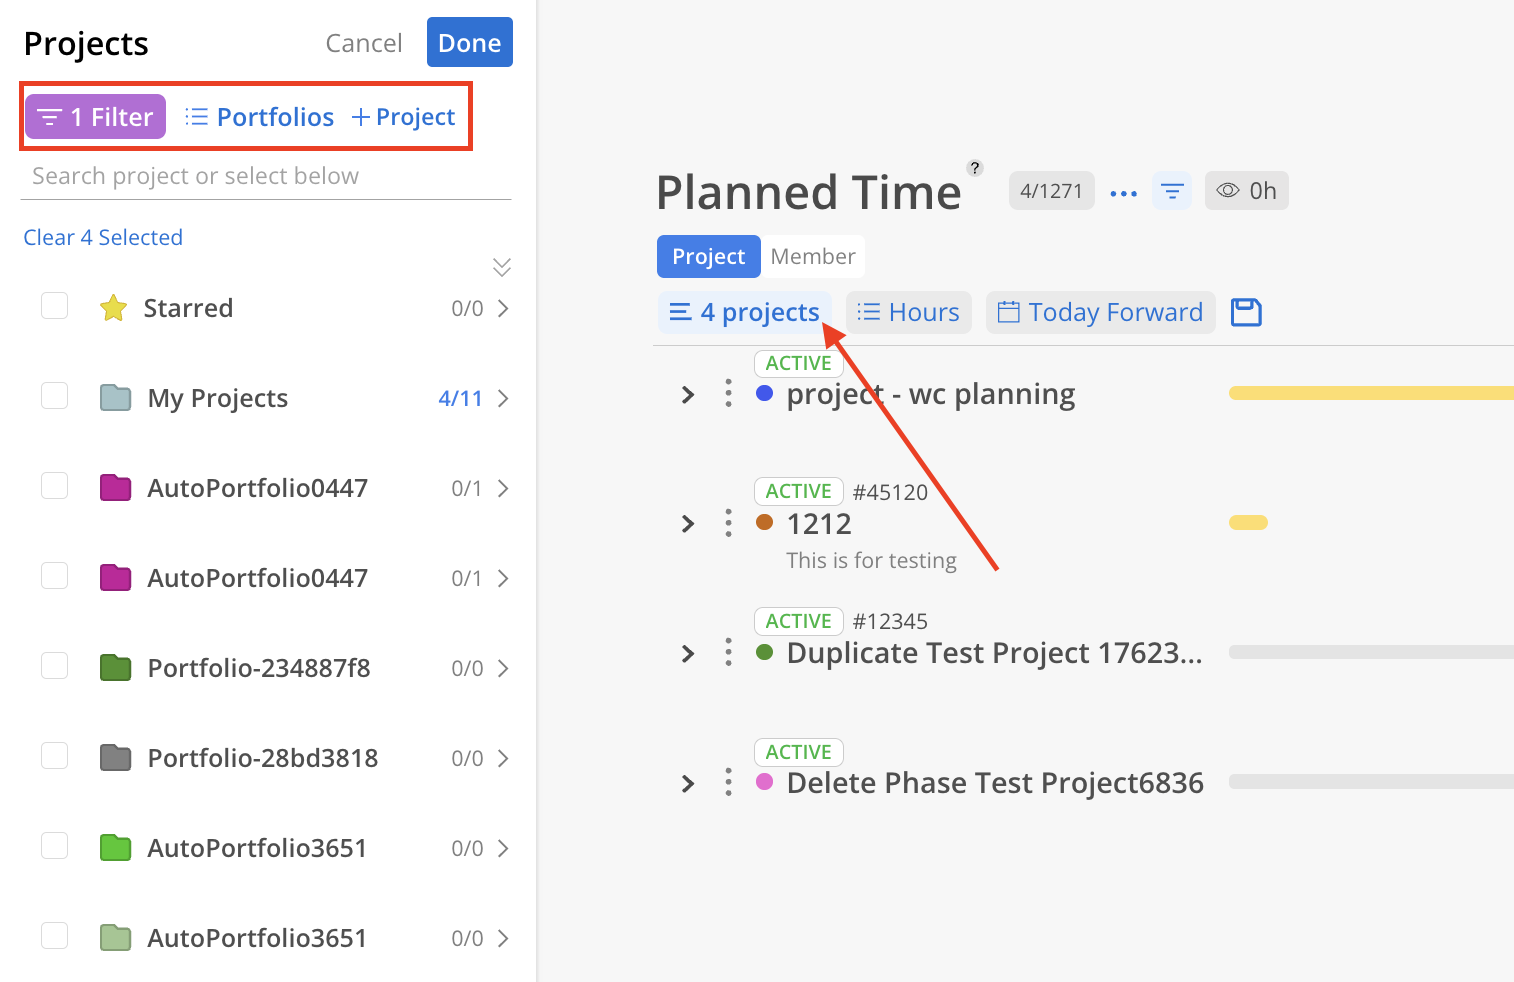
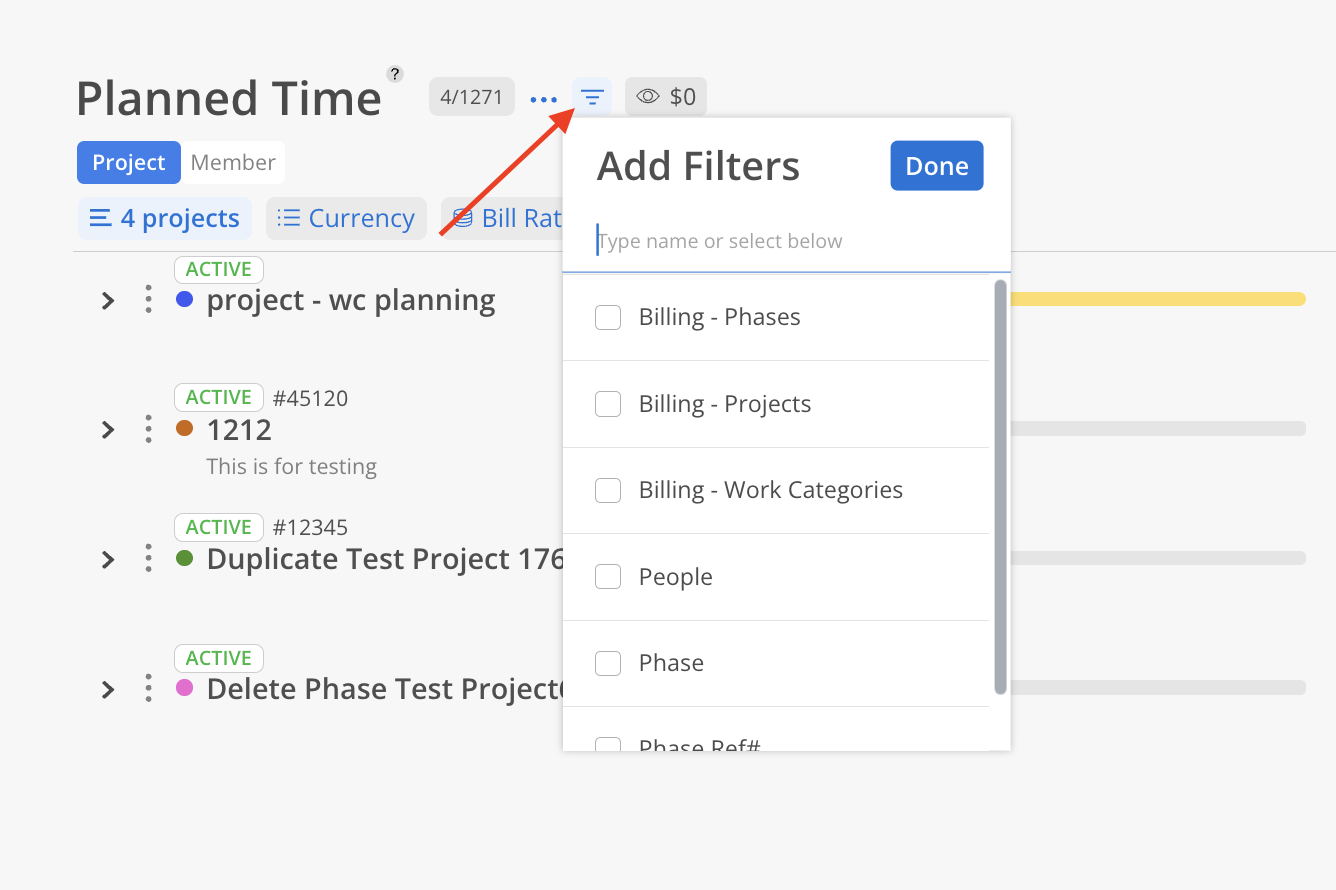
To refine the list of Projects, click the Filter button to drill into specific categories or criteria. Use the Portfolios button to group Projects by Individual Projects, Portfolios, or Members.
To quickly create a new Project, click the +Project button.
Next to the Report title, the number of filtered Projects is displayed alongside the total count.
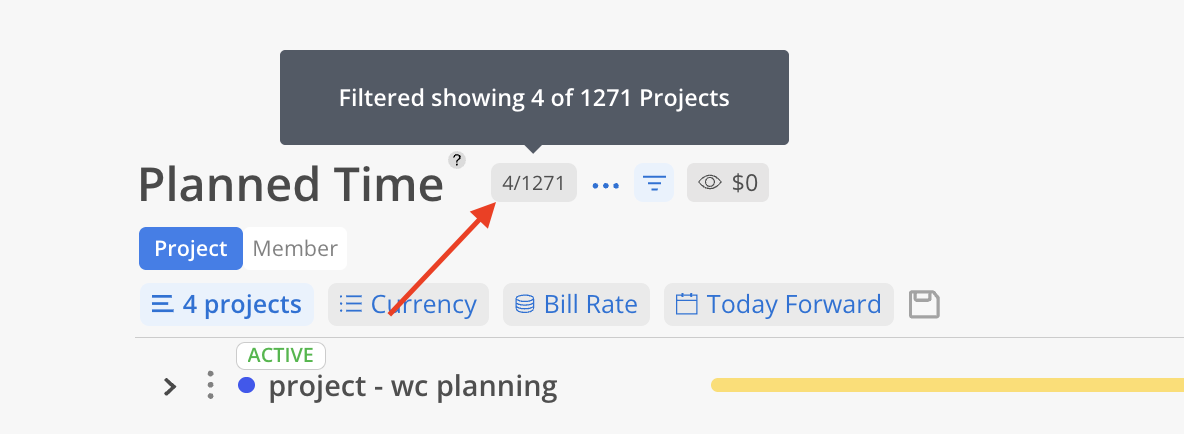
Selected Projects can be filtered using various criteria to help narrow down results and locate specific records. These filters allow for refinement based on project attributes and status.
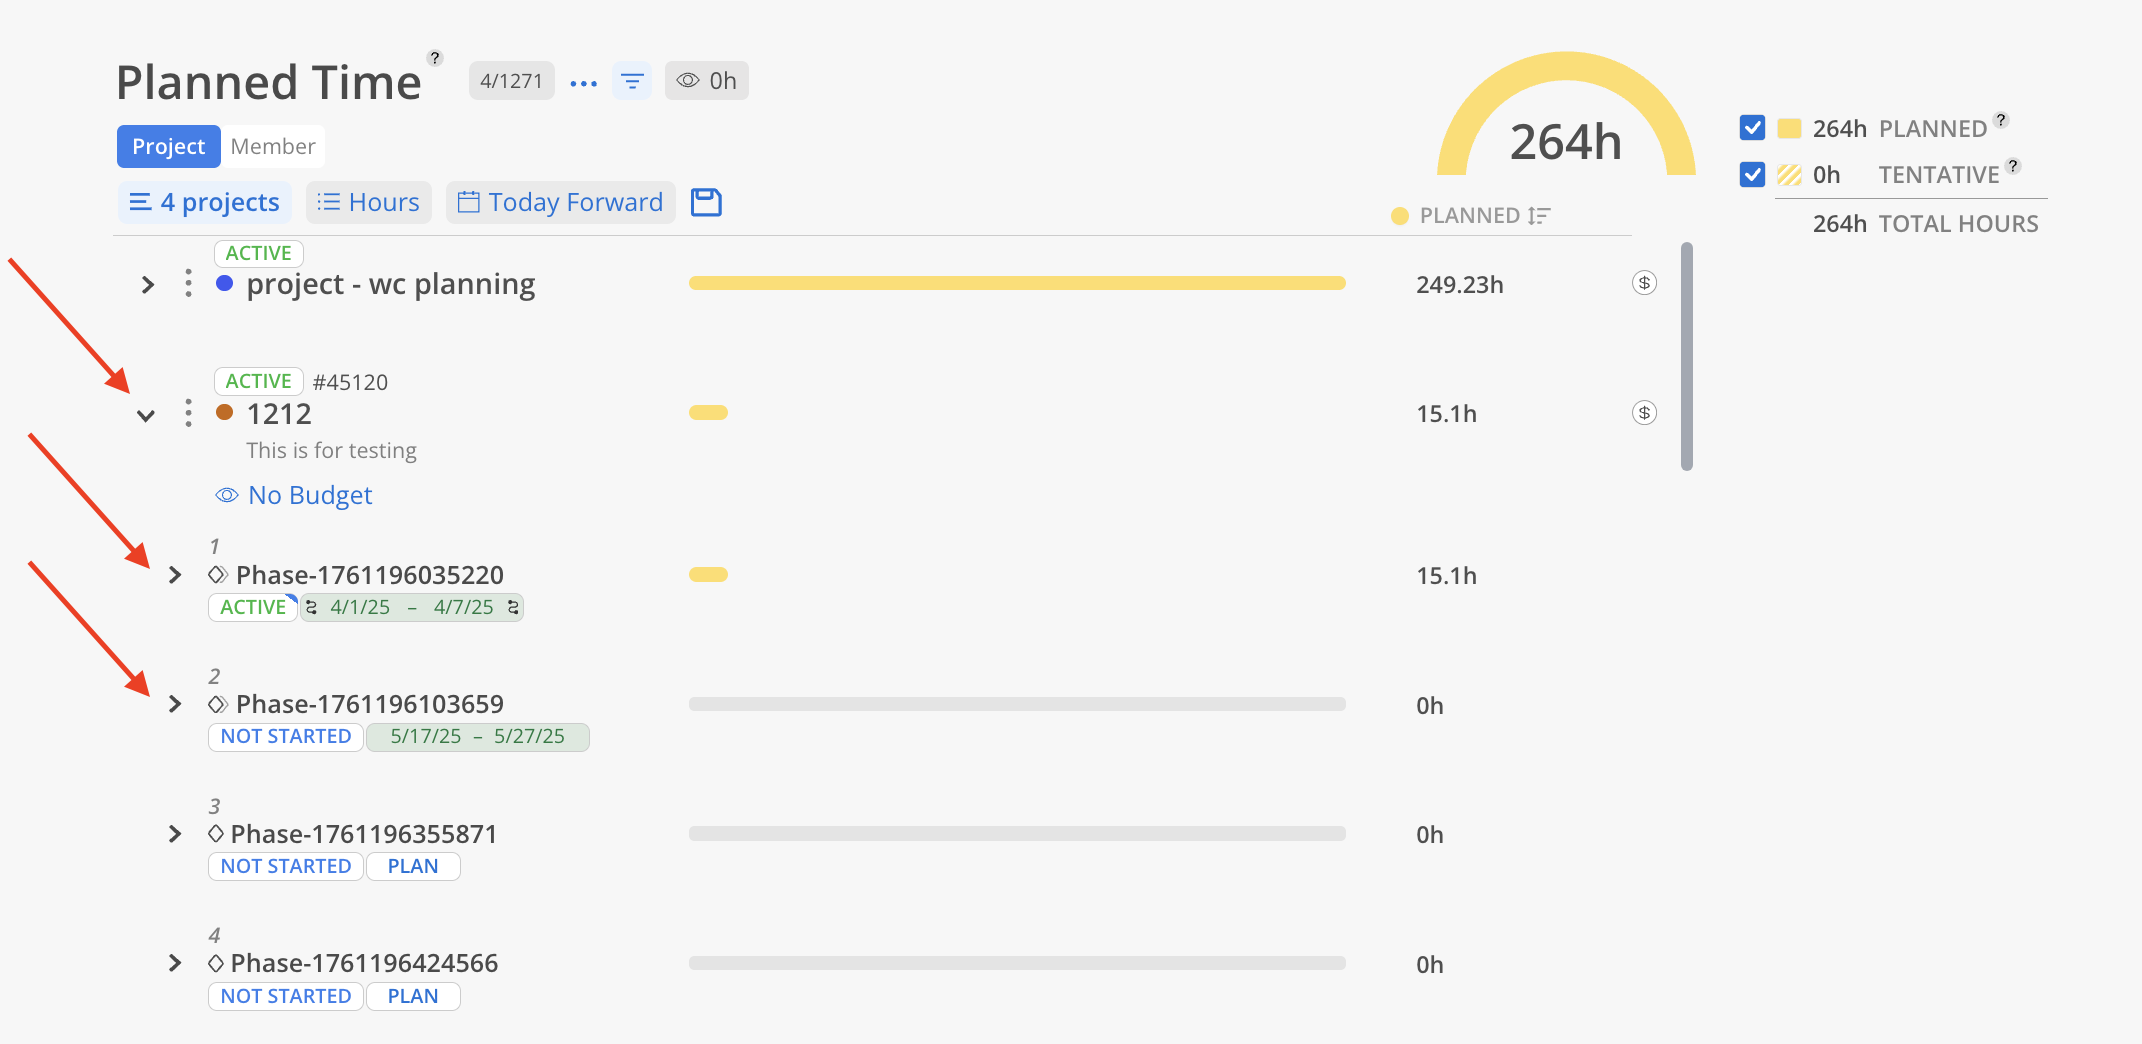
Click on the caret next to the project name in order to expand and view more granular phase level and member level planned time.
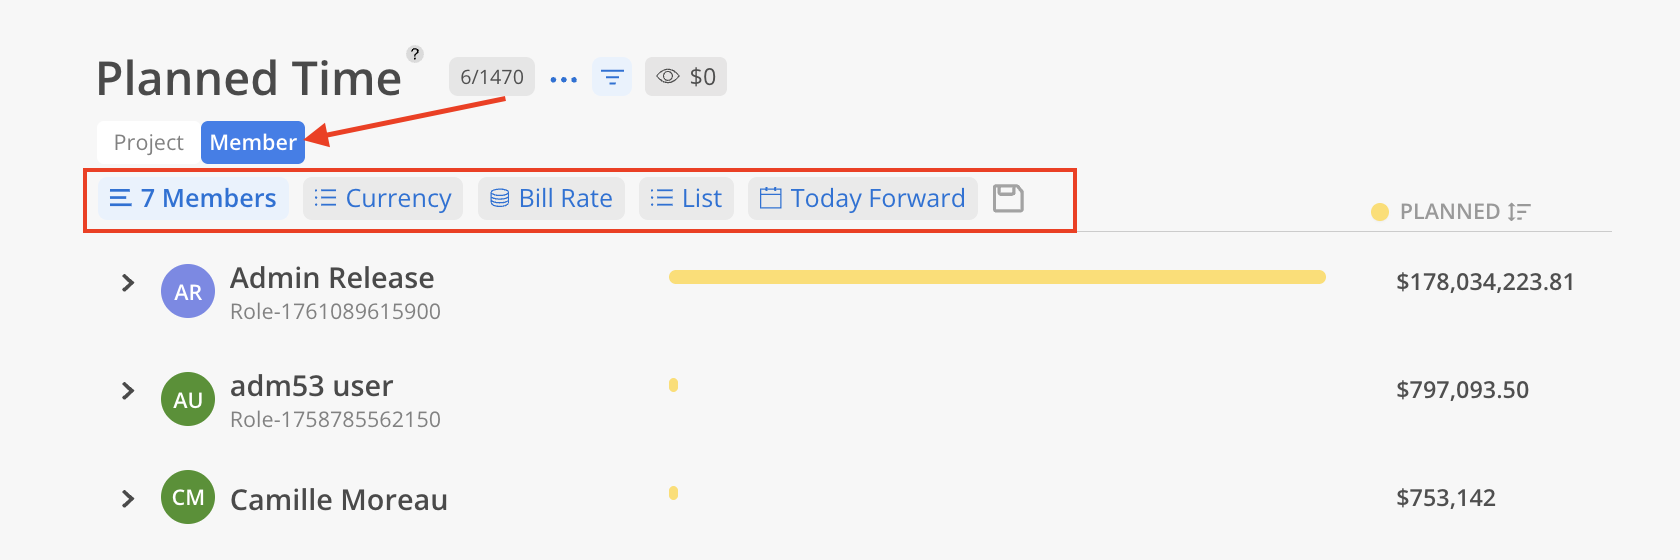
To view this by member, select the Member tab at the top of the report.
Similar to the Project tab, here are several options
Select Members to view
Switch between Currency or Hours view.
Select to view currency by Bill Rate or Cost Rate, with access to the Cost Rate view depending on appropriate permission settings.
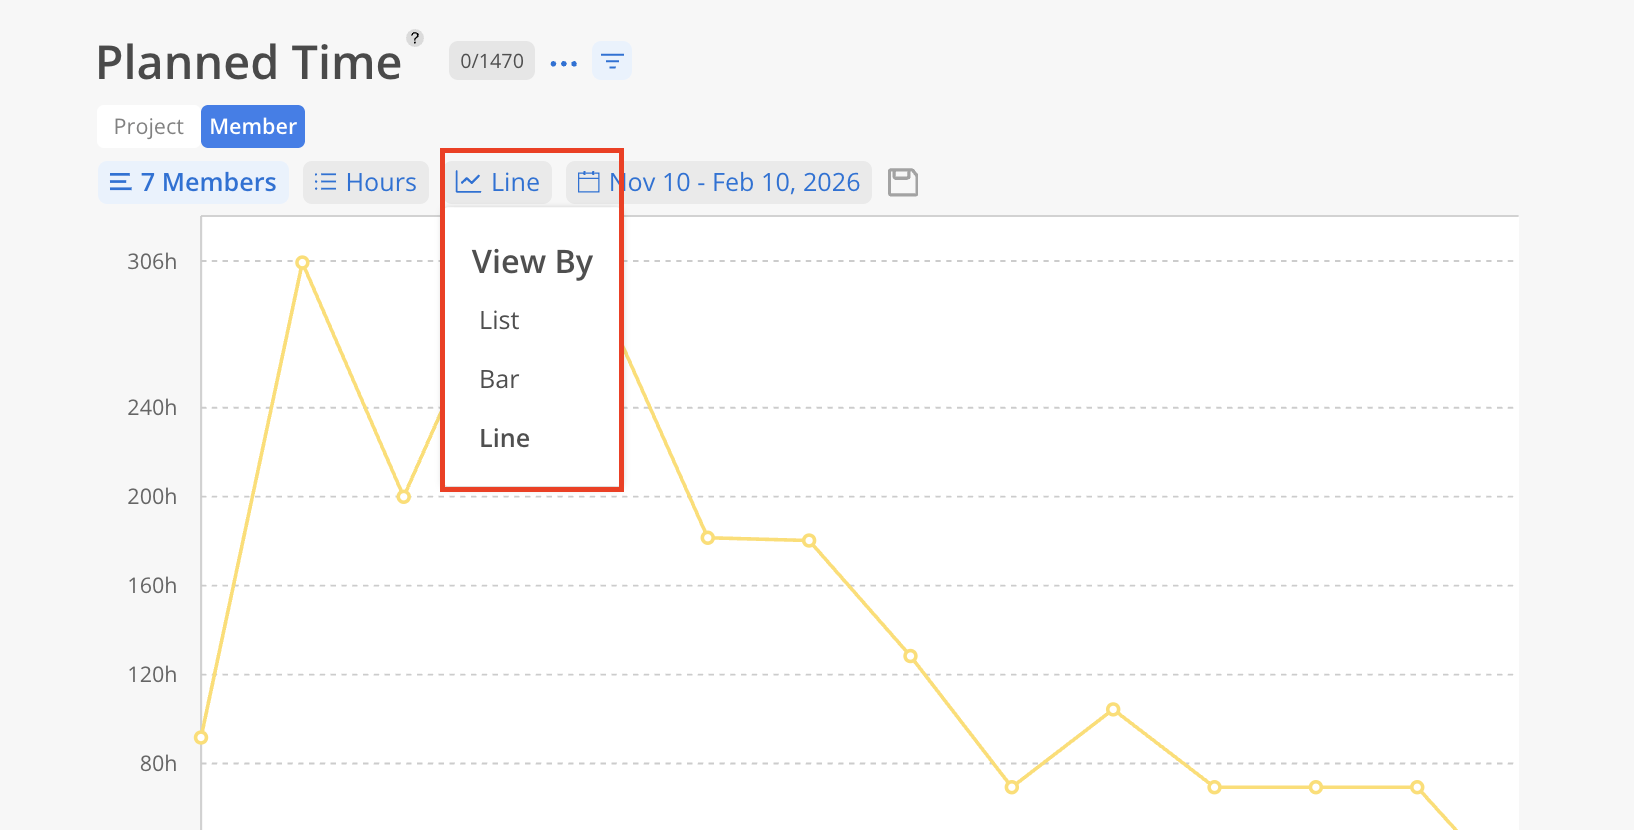
View by opions, including list, bar chart and line graph views.
Time Period to view: From Today, This Week, Next Week, Next 30 Days, Next 3 Months, All Time or Custom
Save: Save the filters for next time.
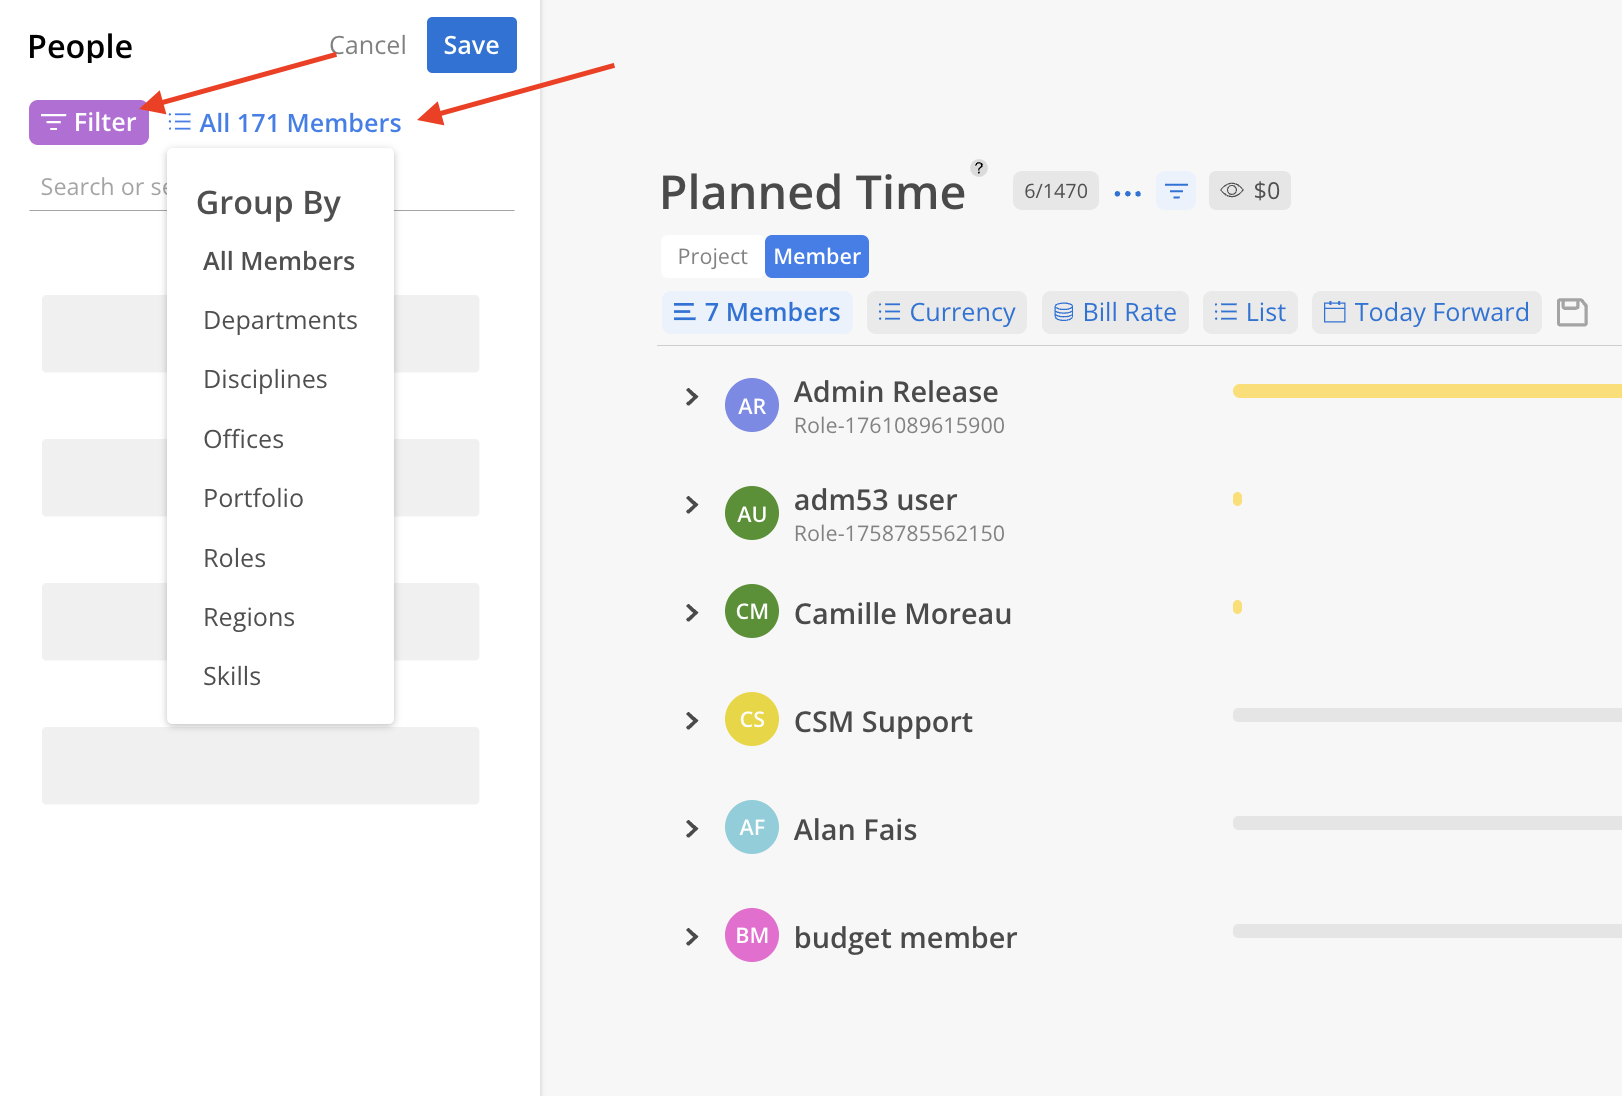
To view specific Members, select them directly from the list. Use the Filter button in the top-left corner to narrow the list based on defined criteria.
Click All Members to group Members by categories such as Department, Discipline, Office, Portfolio, Role, Region, or Skill.
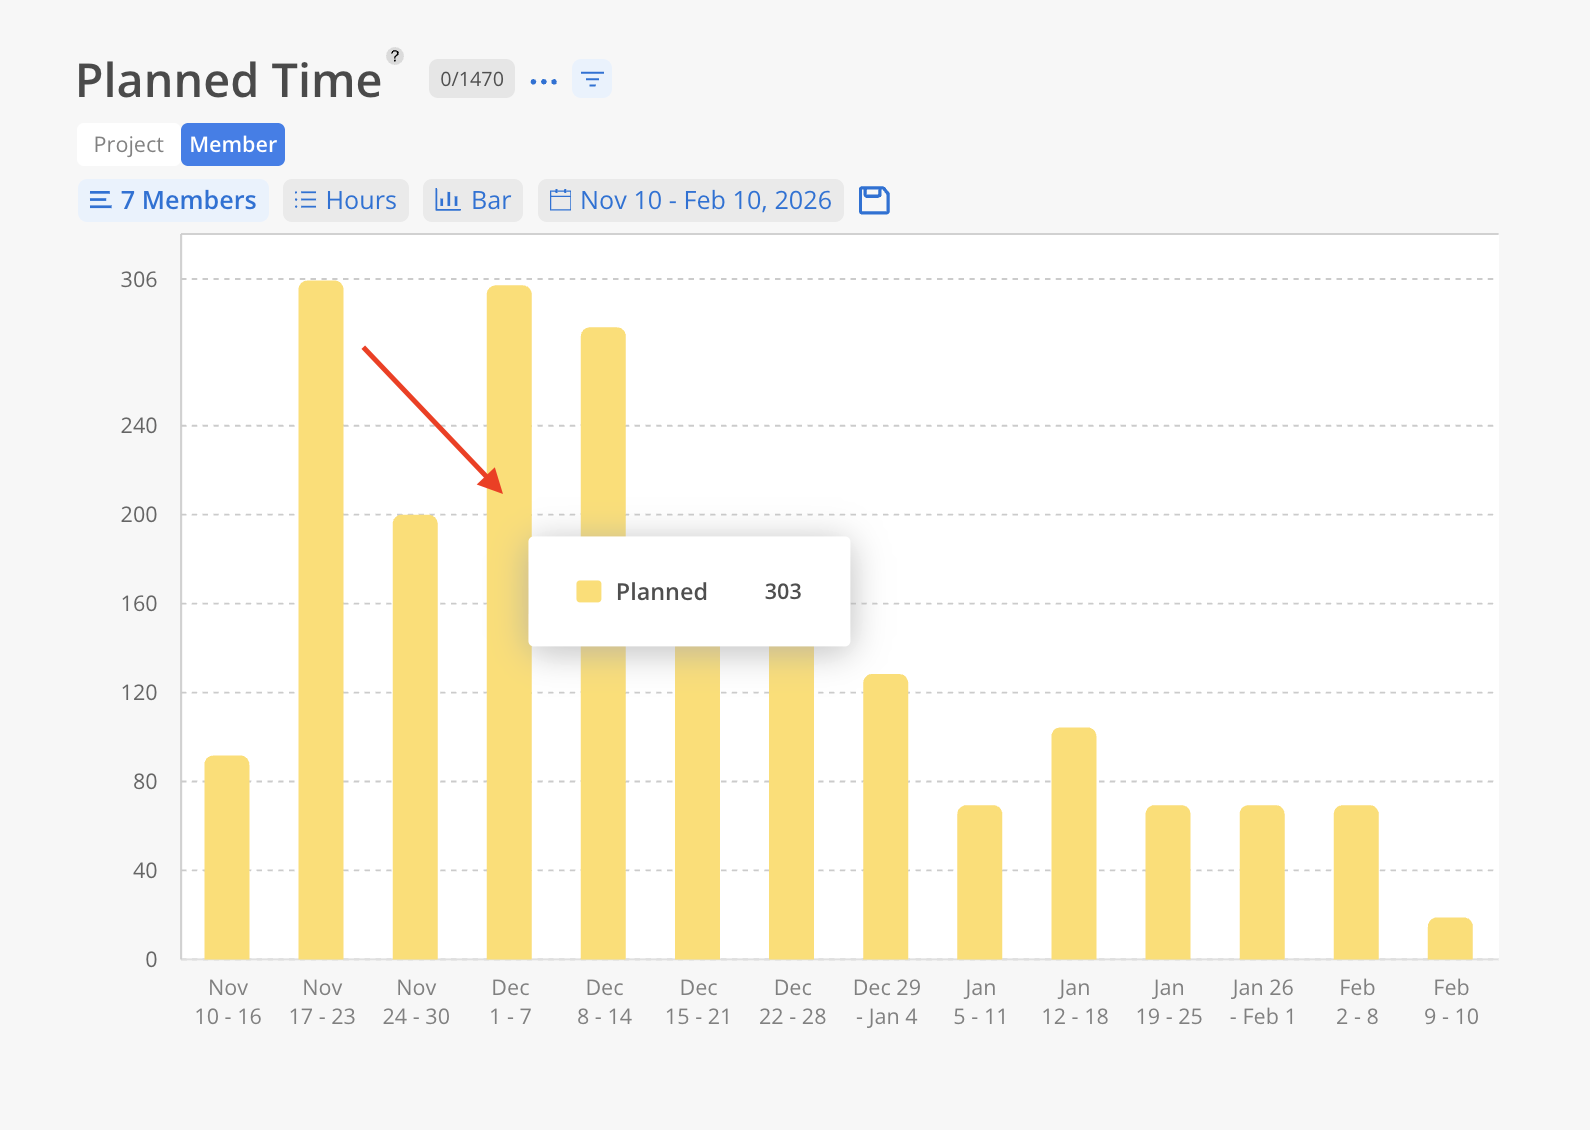
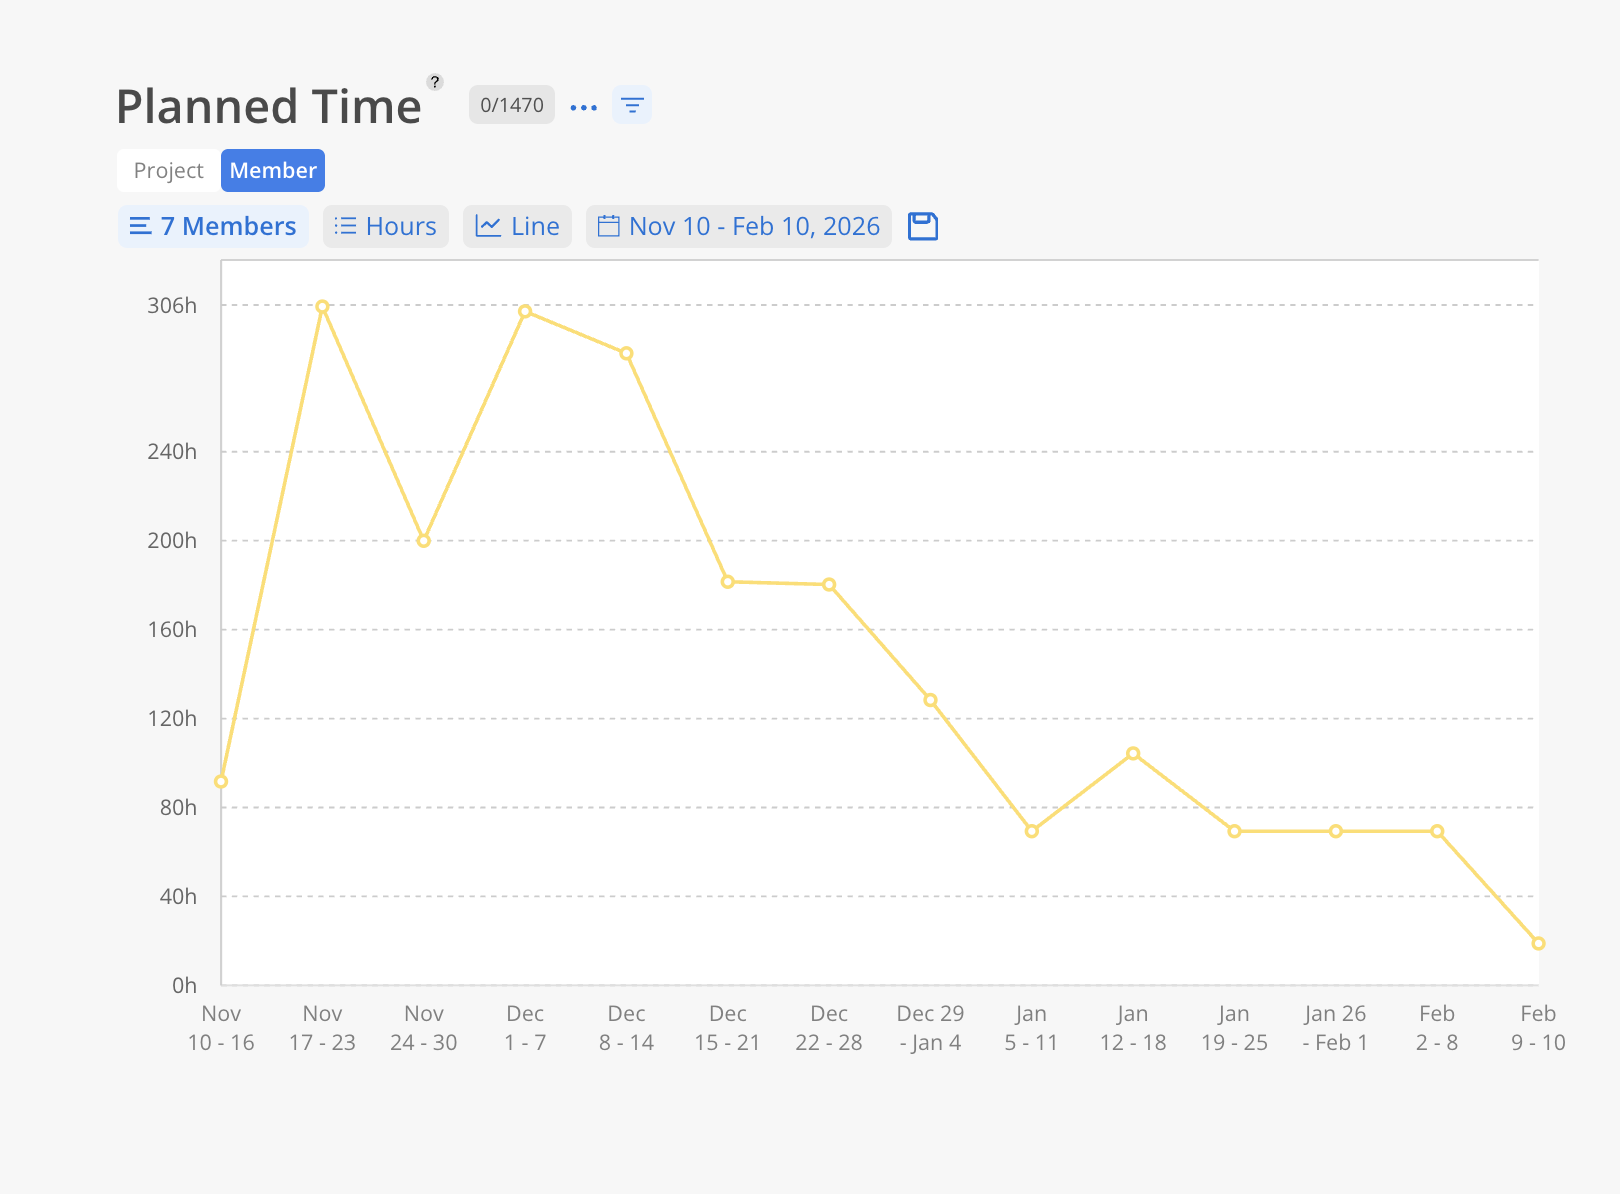
Member data can be viewed in multiple ways, including list, bar chart and line graph view. These options provide clear visual representations of team allocations, making resource planning more efficient and intuitive.
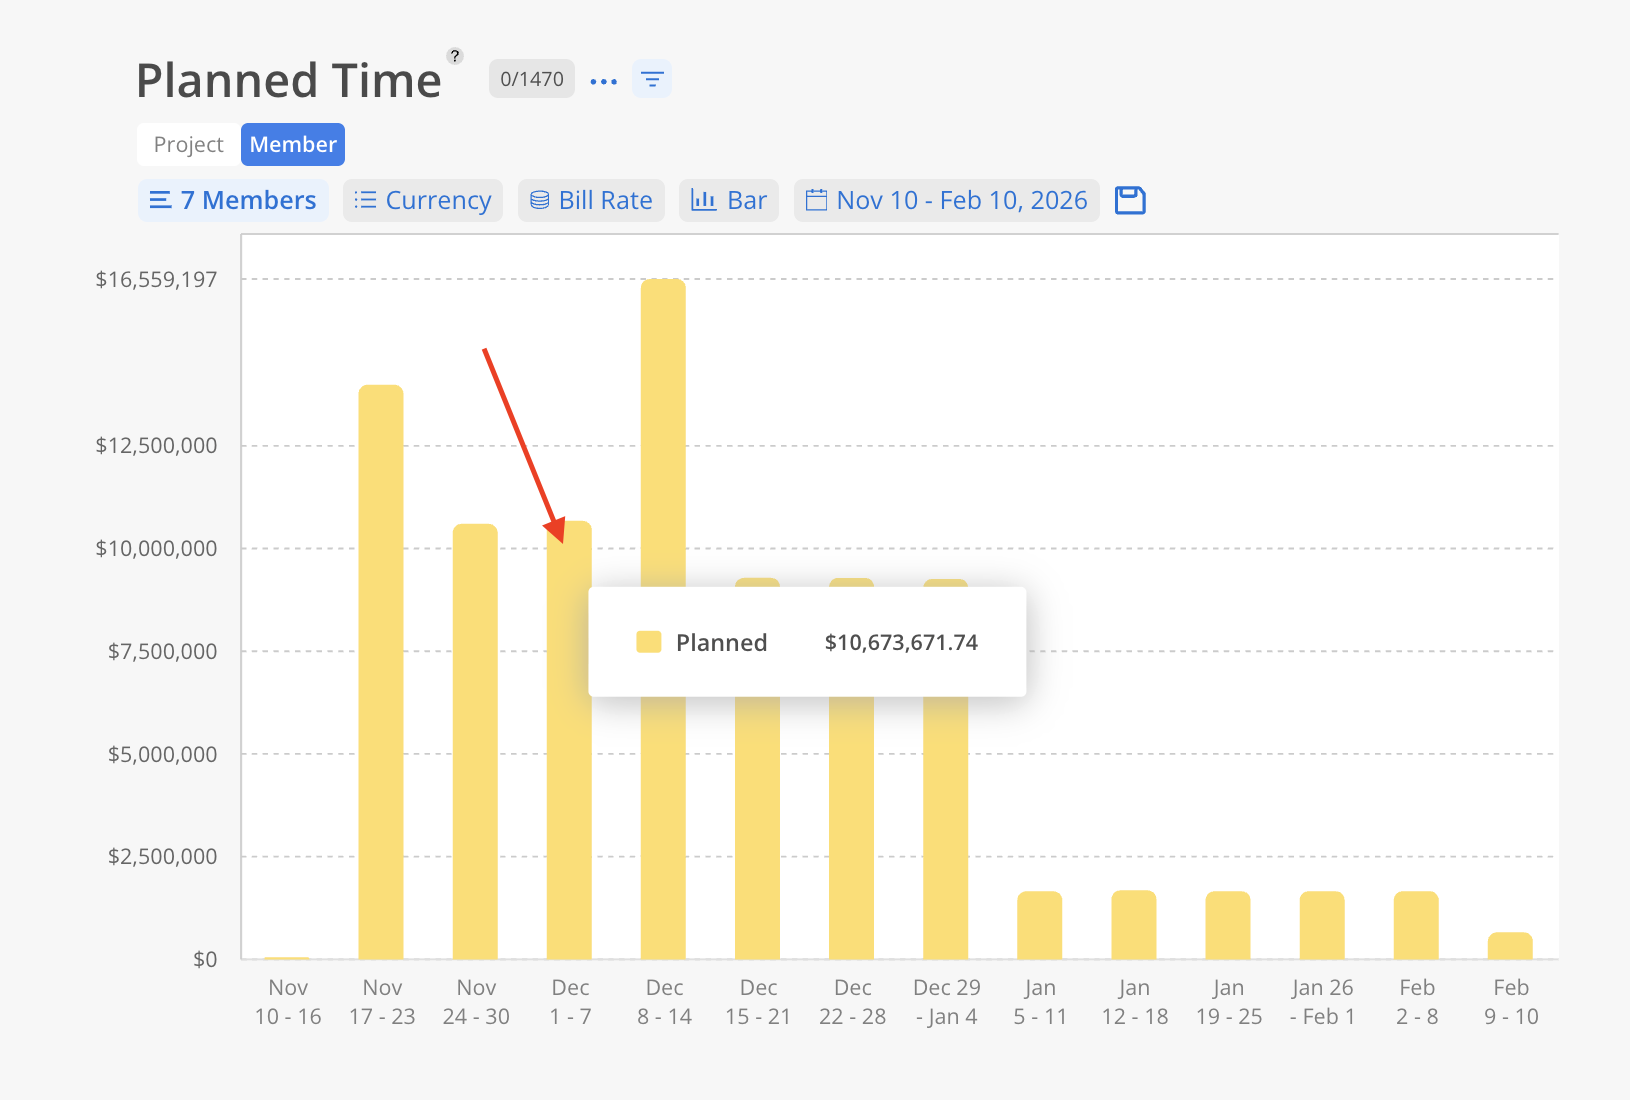
Hovering over a bar or dot reveals the actual number of hours or currency amount depends on the view.
Example of a Line Graph
Lastly, this report can be exported to CSV or XLS by selecting the three dots at the top of the report. This option is available exclusively in the Project view.

Work Planners with the following permissions:
Work Planner > Can Edit > Projects they are a Member of
Work Planner > Can Edit > Projects they are a Project Manager
can only view Projects and Members in the hours view and only for the Projects they have access to (either as a Member or as a Project Manager).
The same condition also applies to the following Budget Manager permissions, but in currency view only, not hours view:
Budget Manager > Can Edit > Projects they are a Member of
Budget Manager > Can Edit > Projects they are a Project Manager
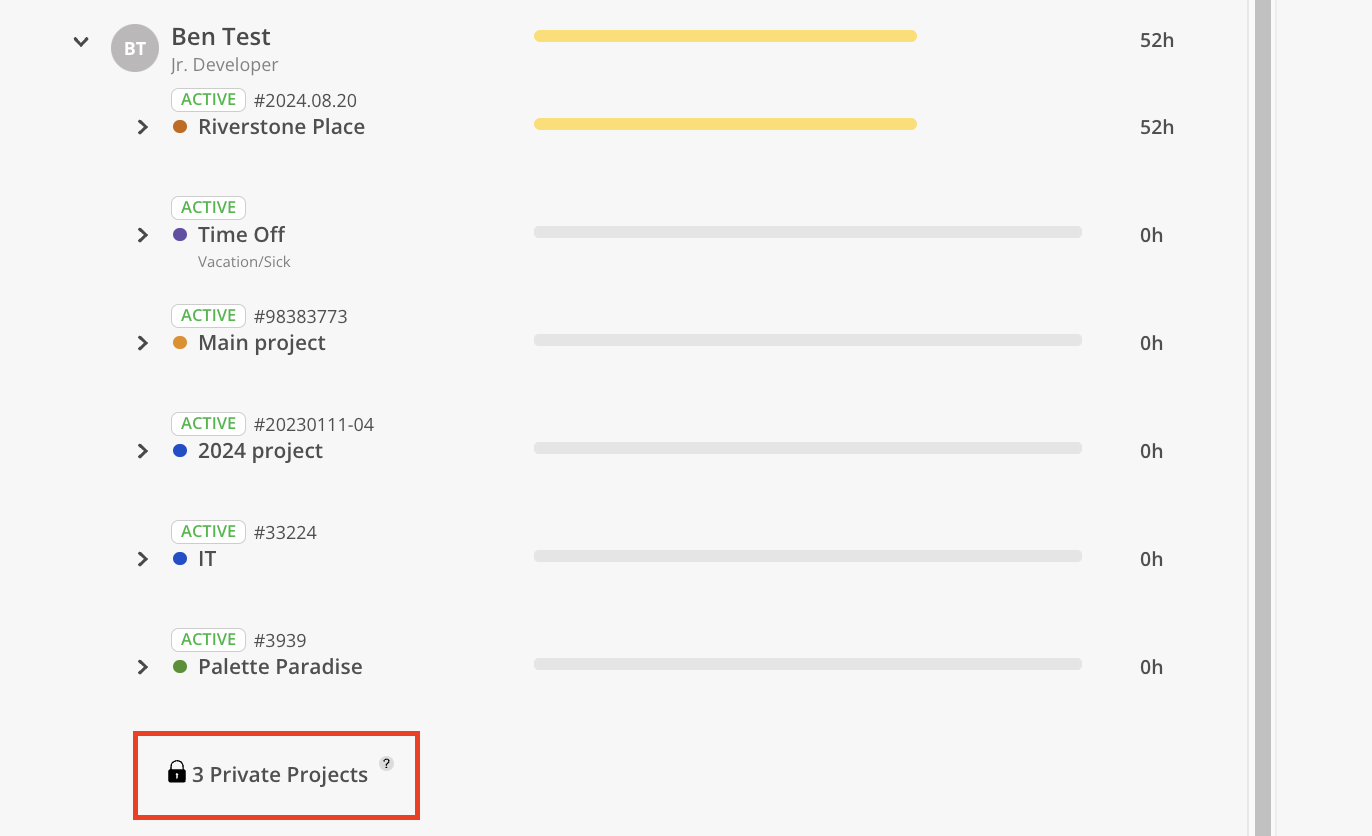
Projects without access permissions will be consolidated into a single row labeled "Private Projects" with the total count displayed. Bar and number will not be shown for this row.
