Schedule Variance Report Video
The Schedule Variance Report allows you to look at a project's initial workday estimates or planned time vs. the actual number of days worked. All filters and selected Projects in this report are automatically saved for future use.
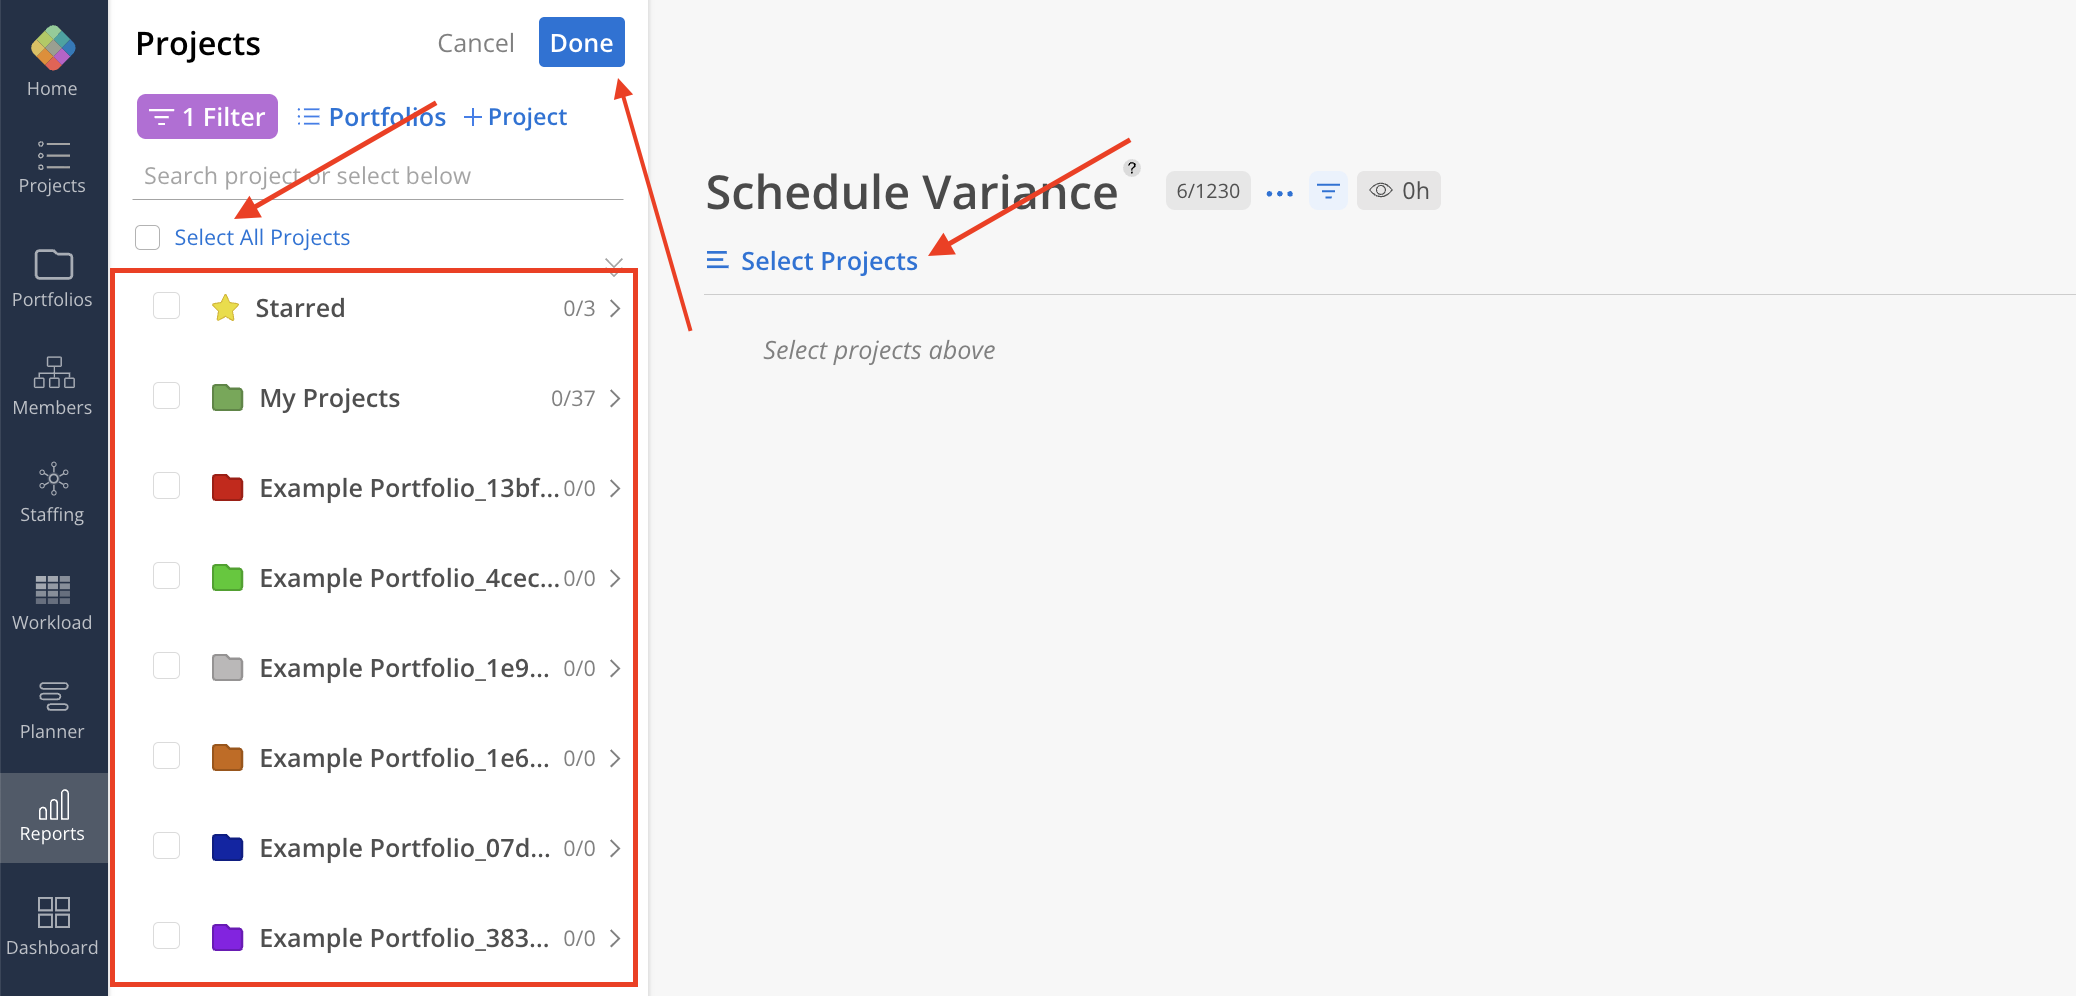
To choose which Projects to view in the report, click Select Projects at the top of the page.
To select all Projects within a Portfolio, check the box next to the Portfolio name.
To select individual Projects, check them one by one.
To include all existing Projects, click Select All Projects at the top.
Once selection is complete, click Done to apply the changes.
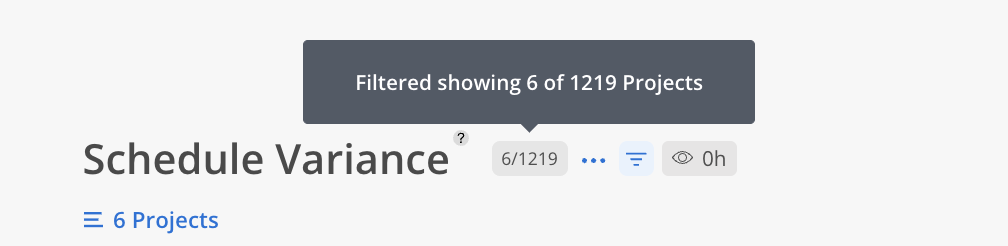
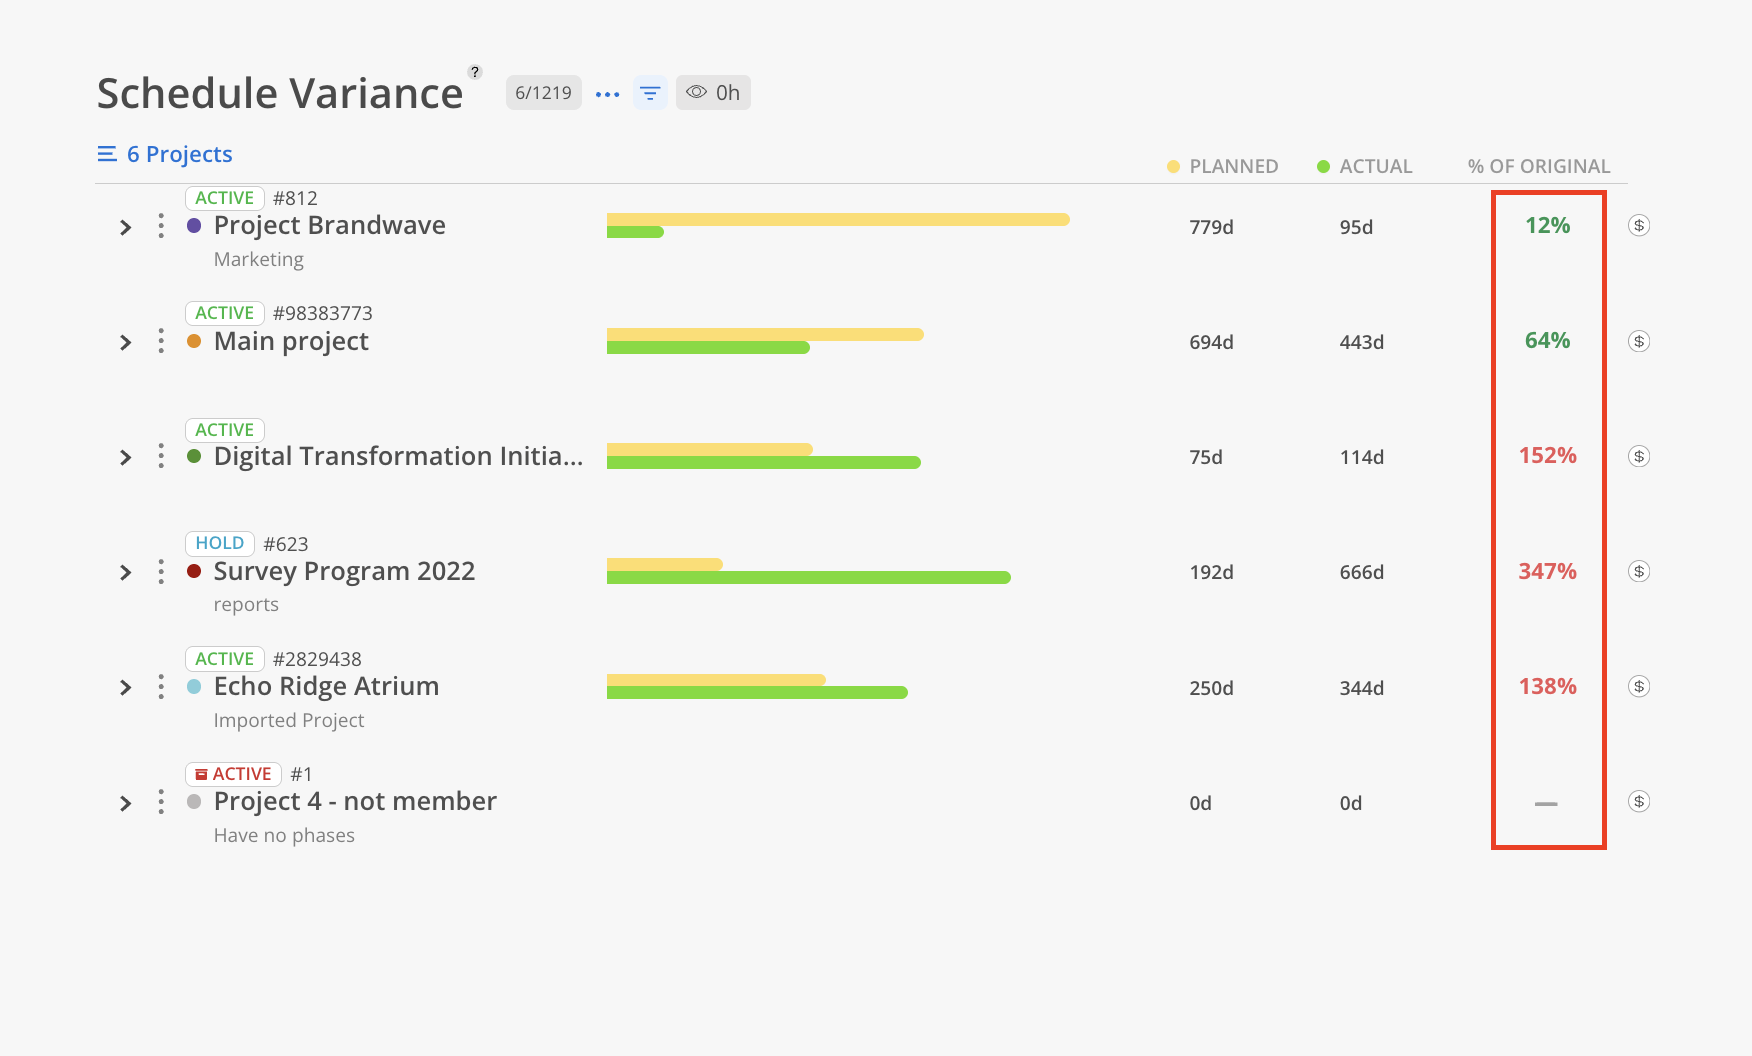
Next to the Report title, the number of filtered Projects is displayed alongside the total count.
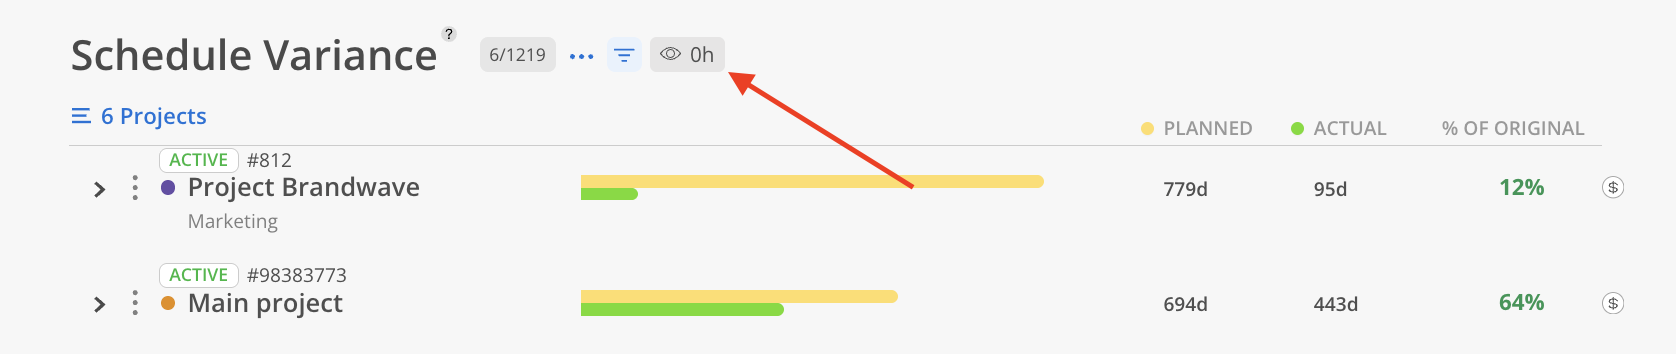
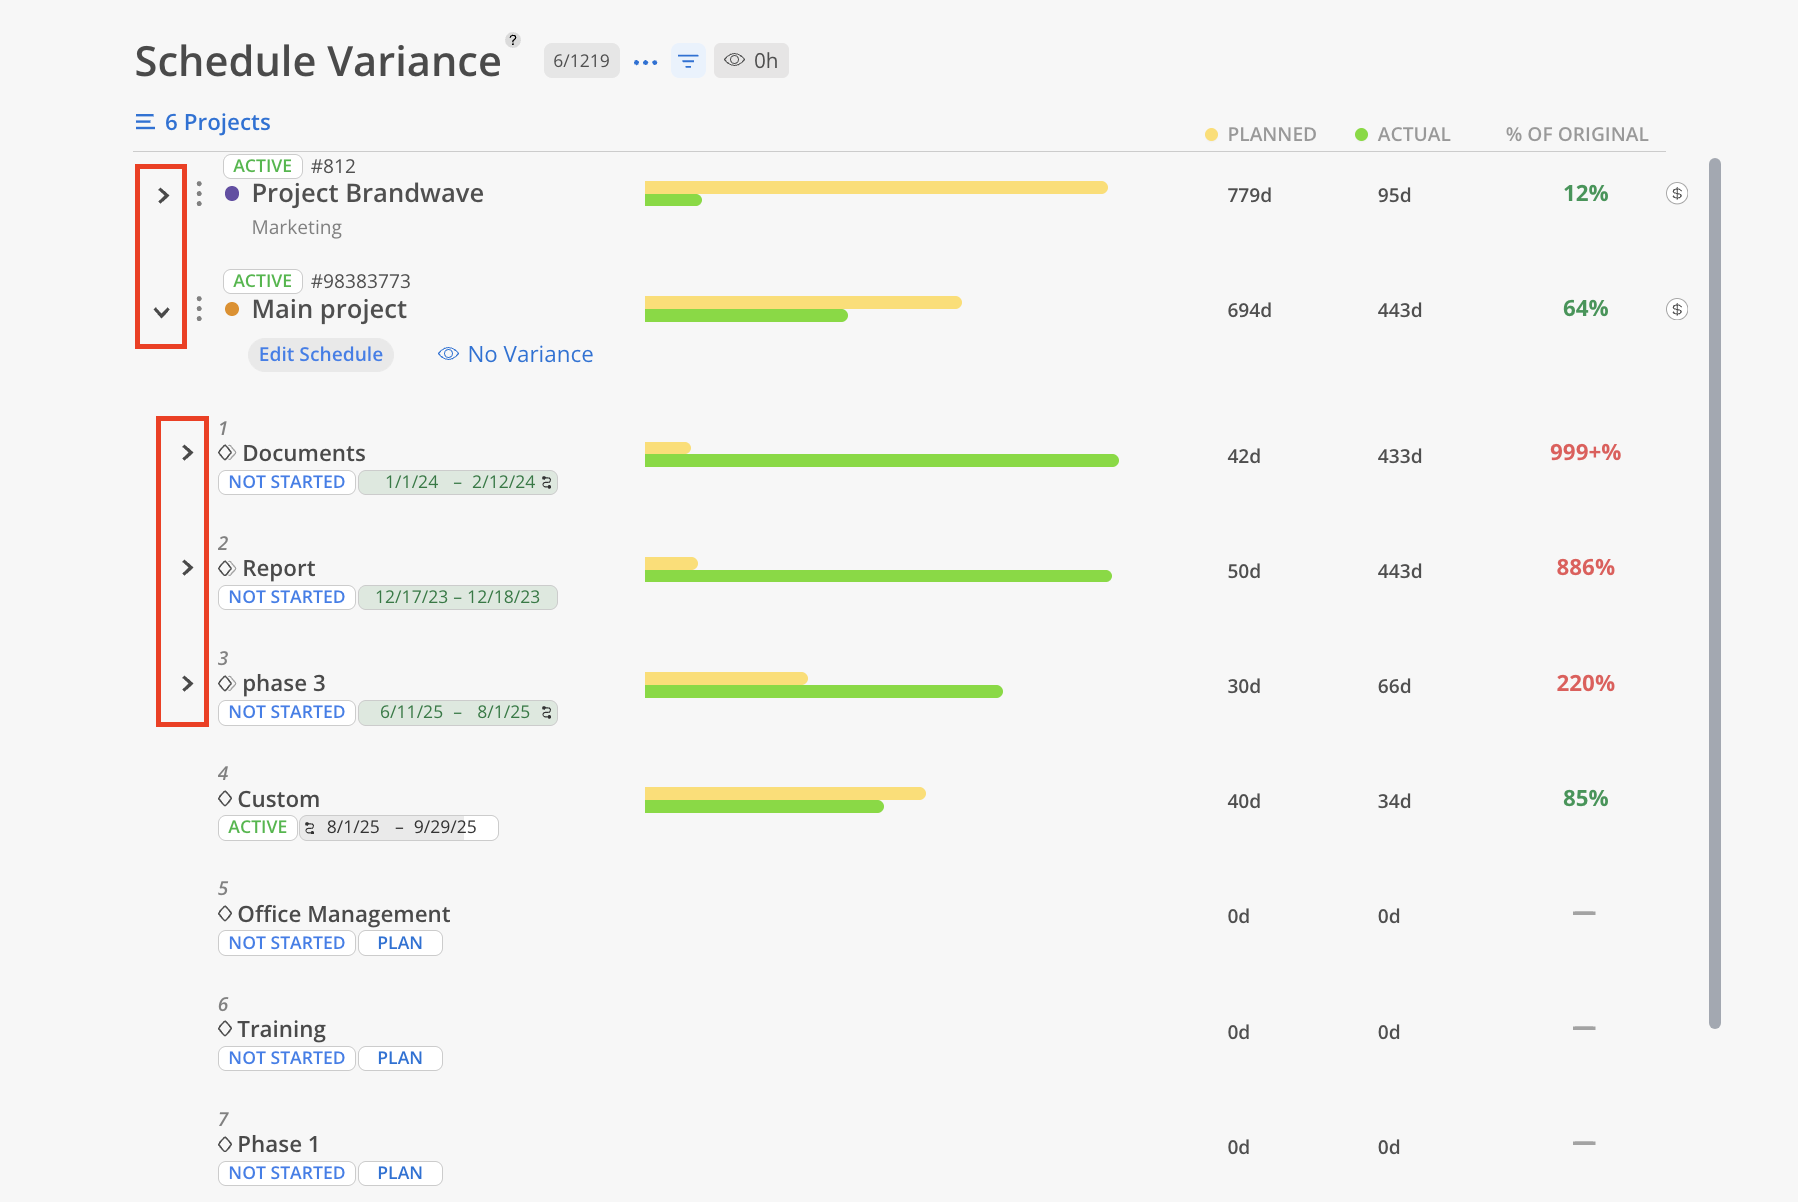
Use the No Variance button on the top to hide the projects when the planned column is blank or there is no variance.
Project Planned is calculated as the number of working days (excluding weekends and holidays) between the earliest Phase’s Baseline Start Date and the latest Phase’s Baseline End Date within the Project.
Project Actual is the number of working days between earliest Phase Start Date and latest Phase End Date (excluding weekends and holidays).

On the right hand side of the project you will see a green or a red percentage displaying the project's overall performance.
Green = underestimate (actual days worked is below planned amount)
Red = overestimate (actual days worked exceeds planned amount)
Dash is displayed for projects that have no planned dates.
Expanding a Project will allow you to see the variance of each individual Phase and Subphase.
Phase Planned is calculated as the number of working days (excluding weekends and holidays) between the Phase’s Baseline Start Date and Baseline End Date.
Phase Actual is the number of working days between Phase Start Date and Phase End Date, also excluding weekends and holidays.
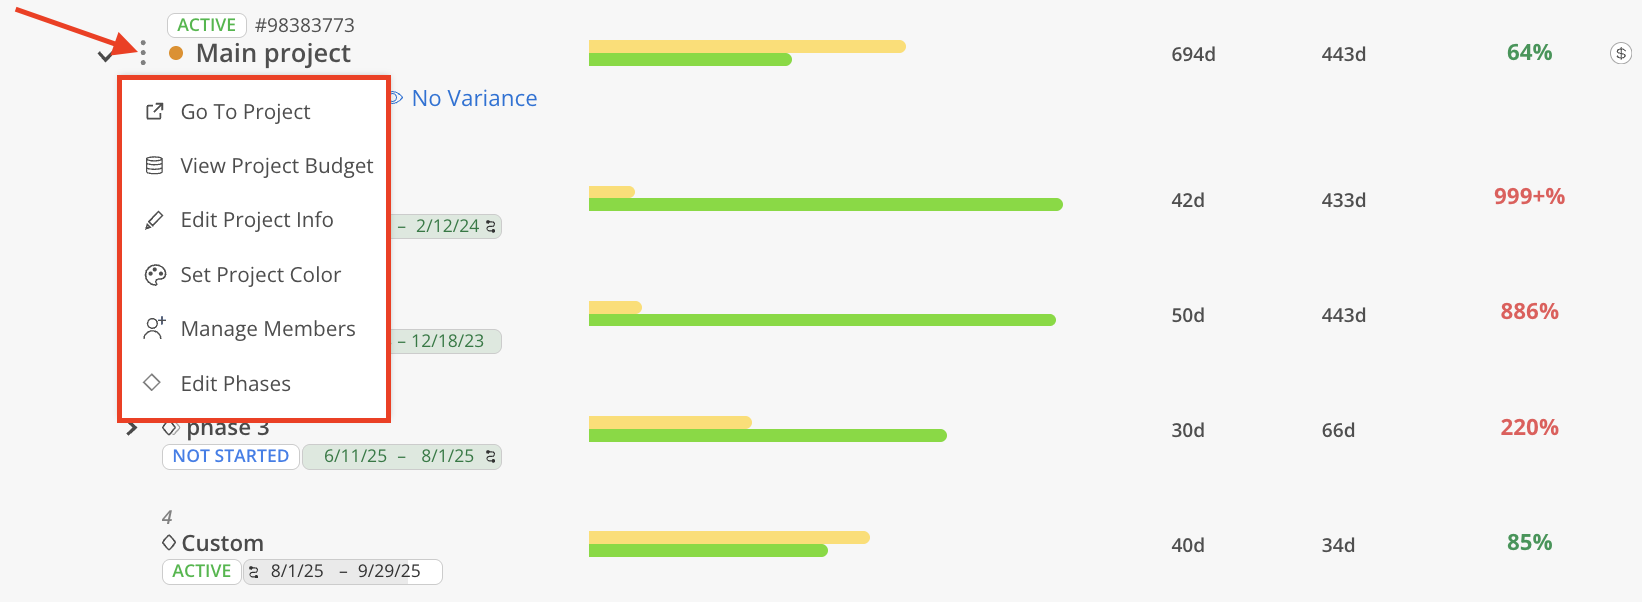
Click the three dots on a Project to:
Go To Project: Open the Project in a new tab
View Project Budget: Open Project Budget Space
Edit Project Info: Open Project Info Modal
Set Project Color: Change the color of the Project
Manage Members: Change Member Project permission, add or remove Members
Edit Phases: Edit Phases information and dates.
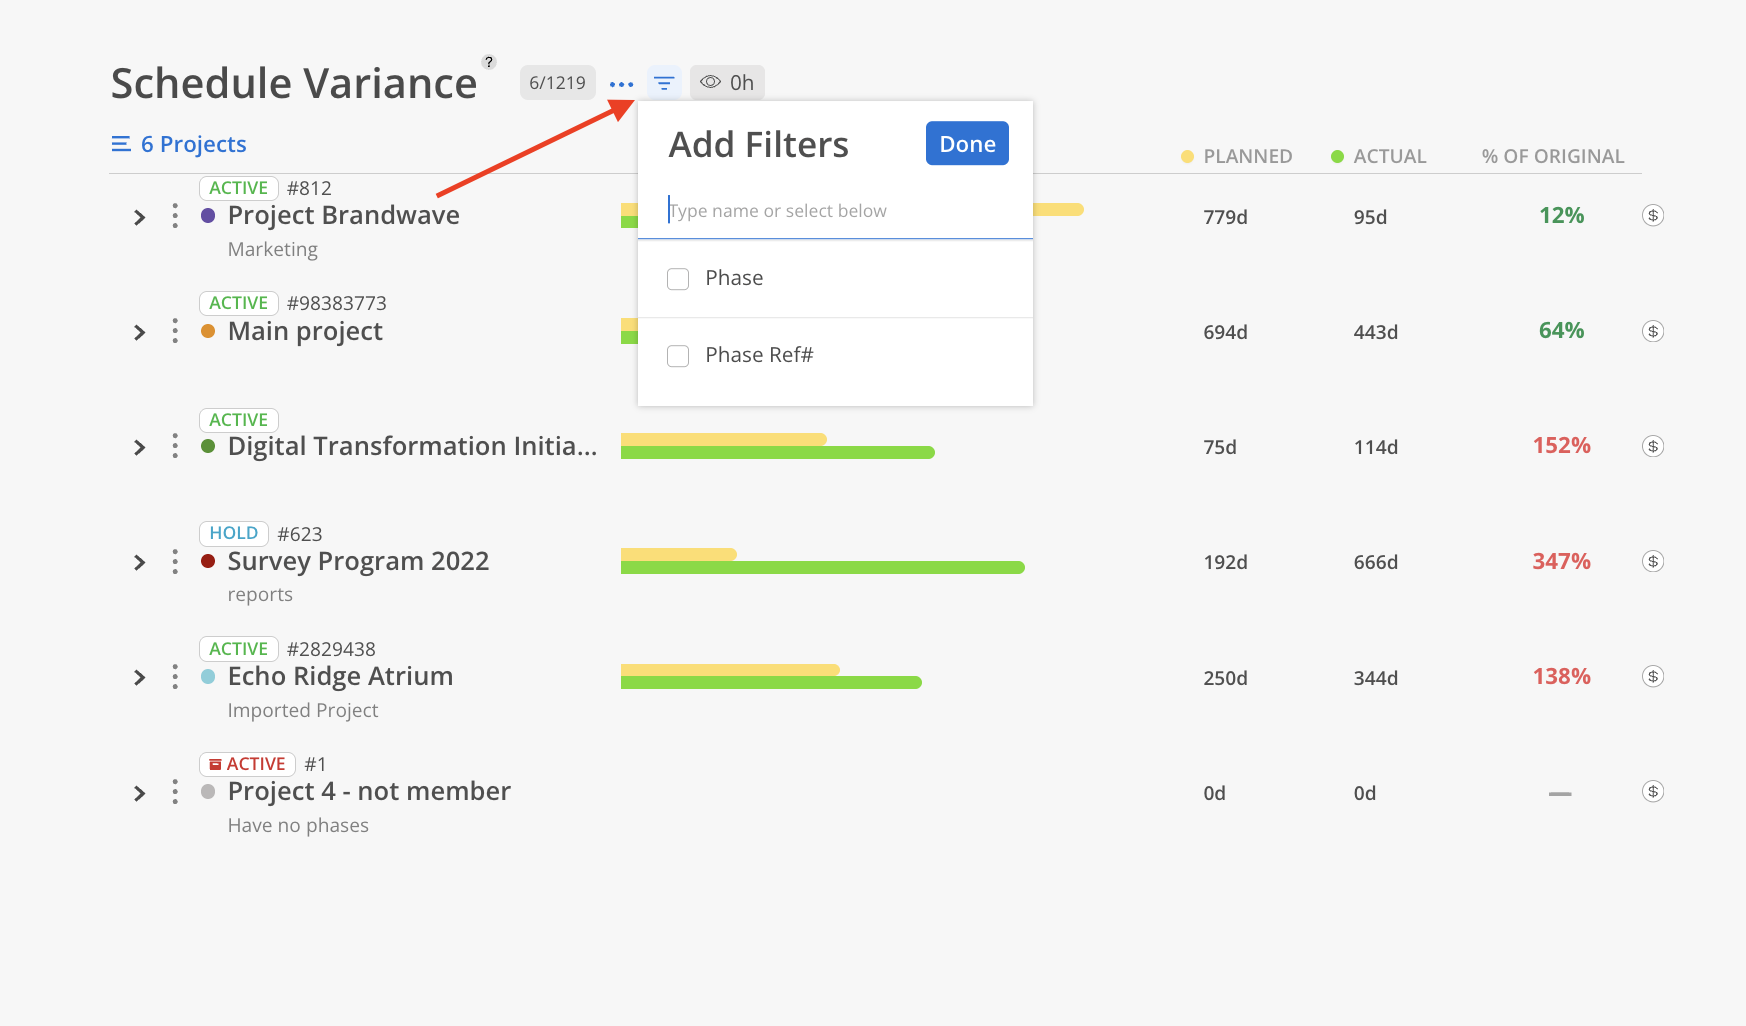
Use the top filter to narrow the selected projects by phase or phase ref#. Applied filters will be highlighted in purple.