The demand report compares upcoming demand for roles against the capacity of staff in those roles to show you when you need to hire or when you need to pursue additional work. All filters, selected Roles, Projects, view options, and date settings in this report are automatically saved for future use.
This report reflects capacity for the selected Default Roles. Default Roles are the primary Roles assigned to members on the Org Settings > Members > All Members tab.
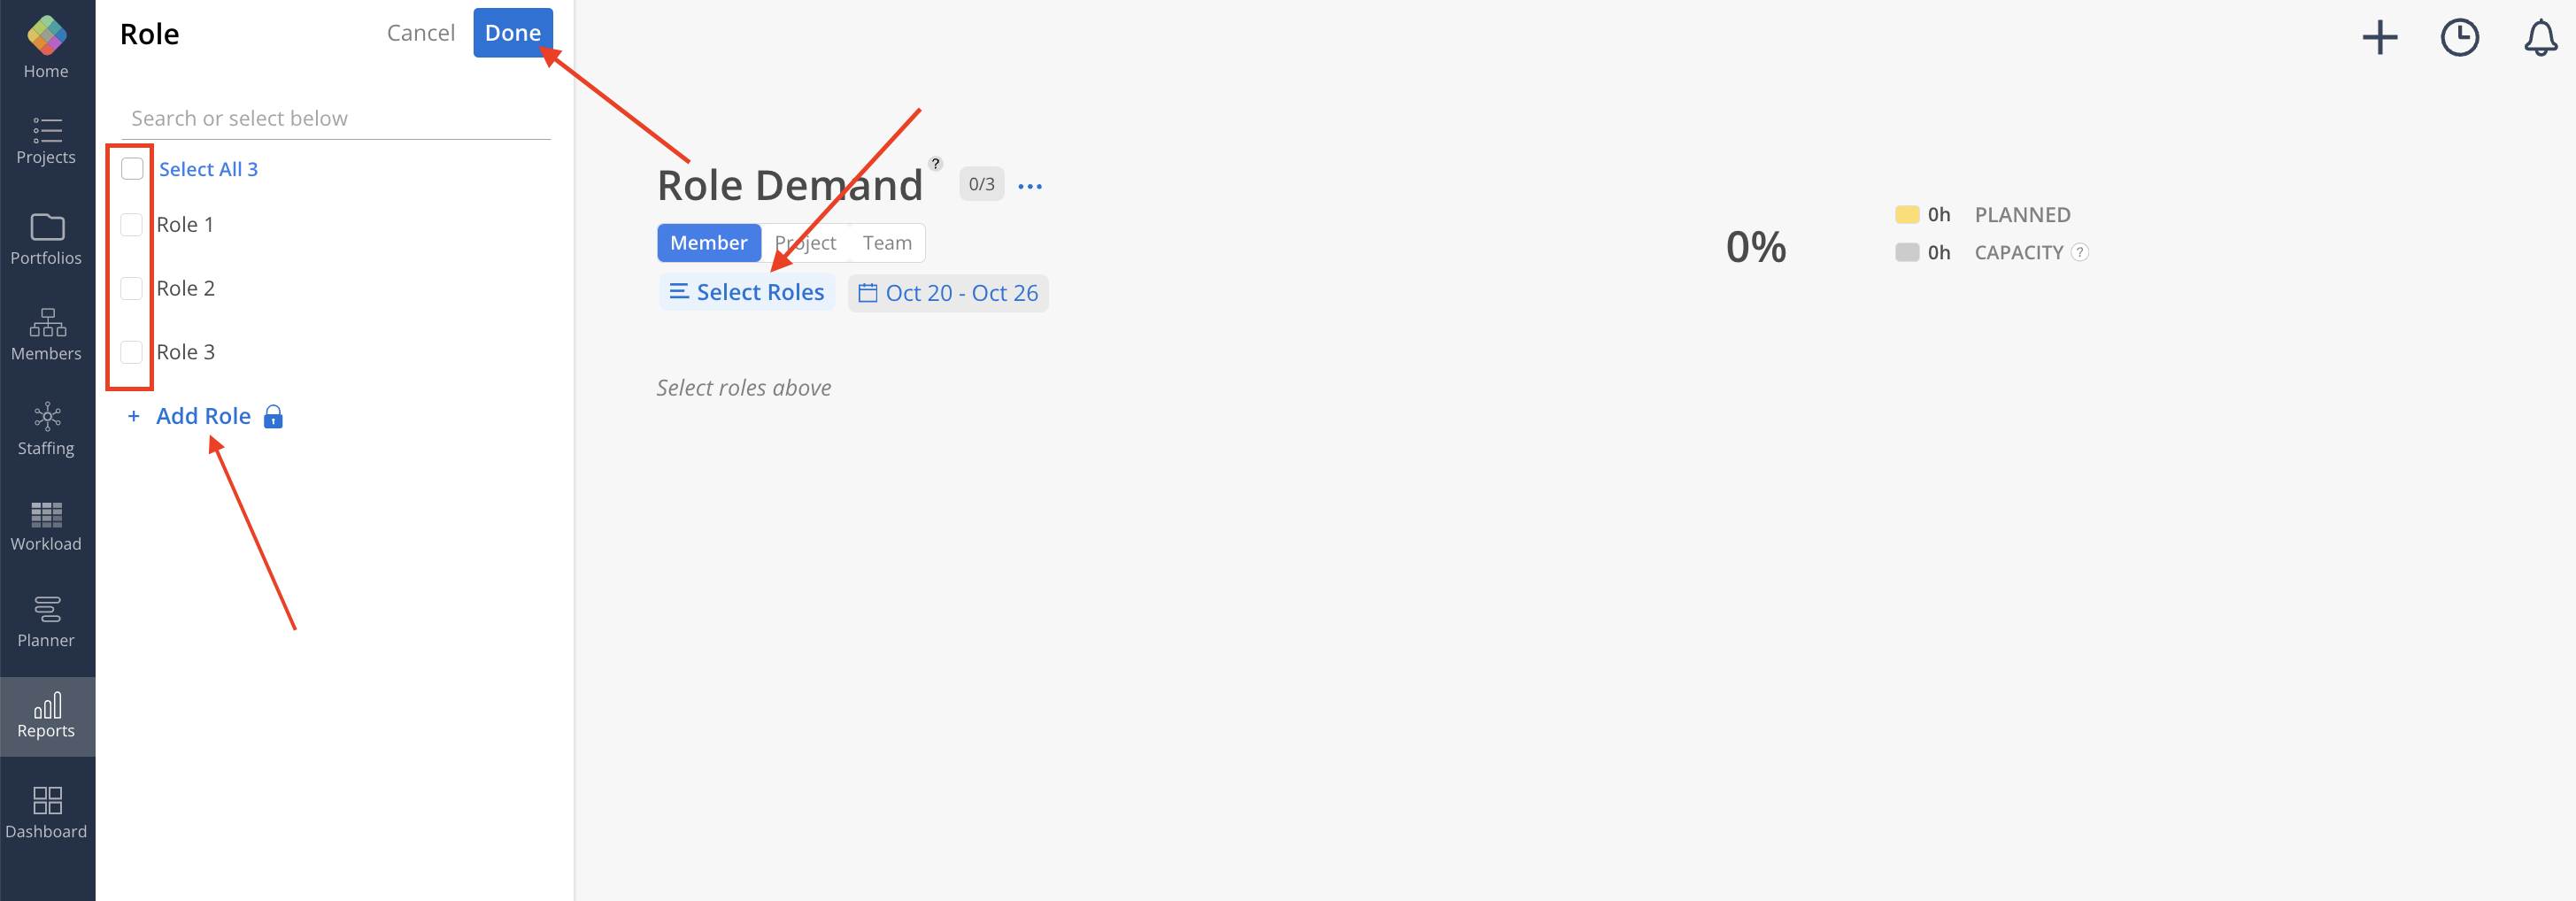
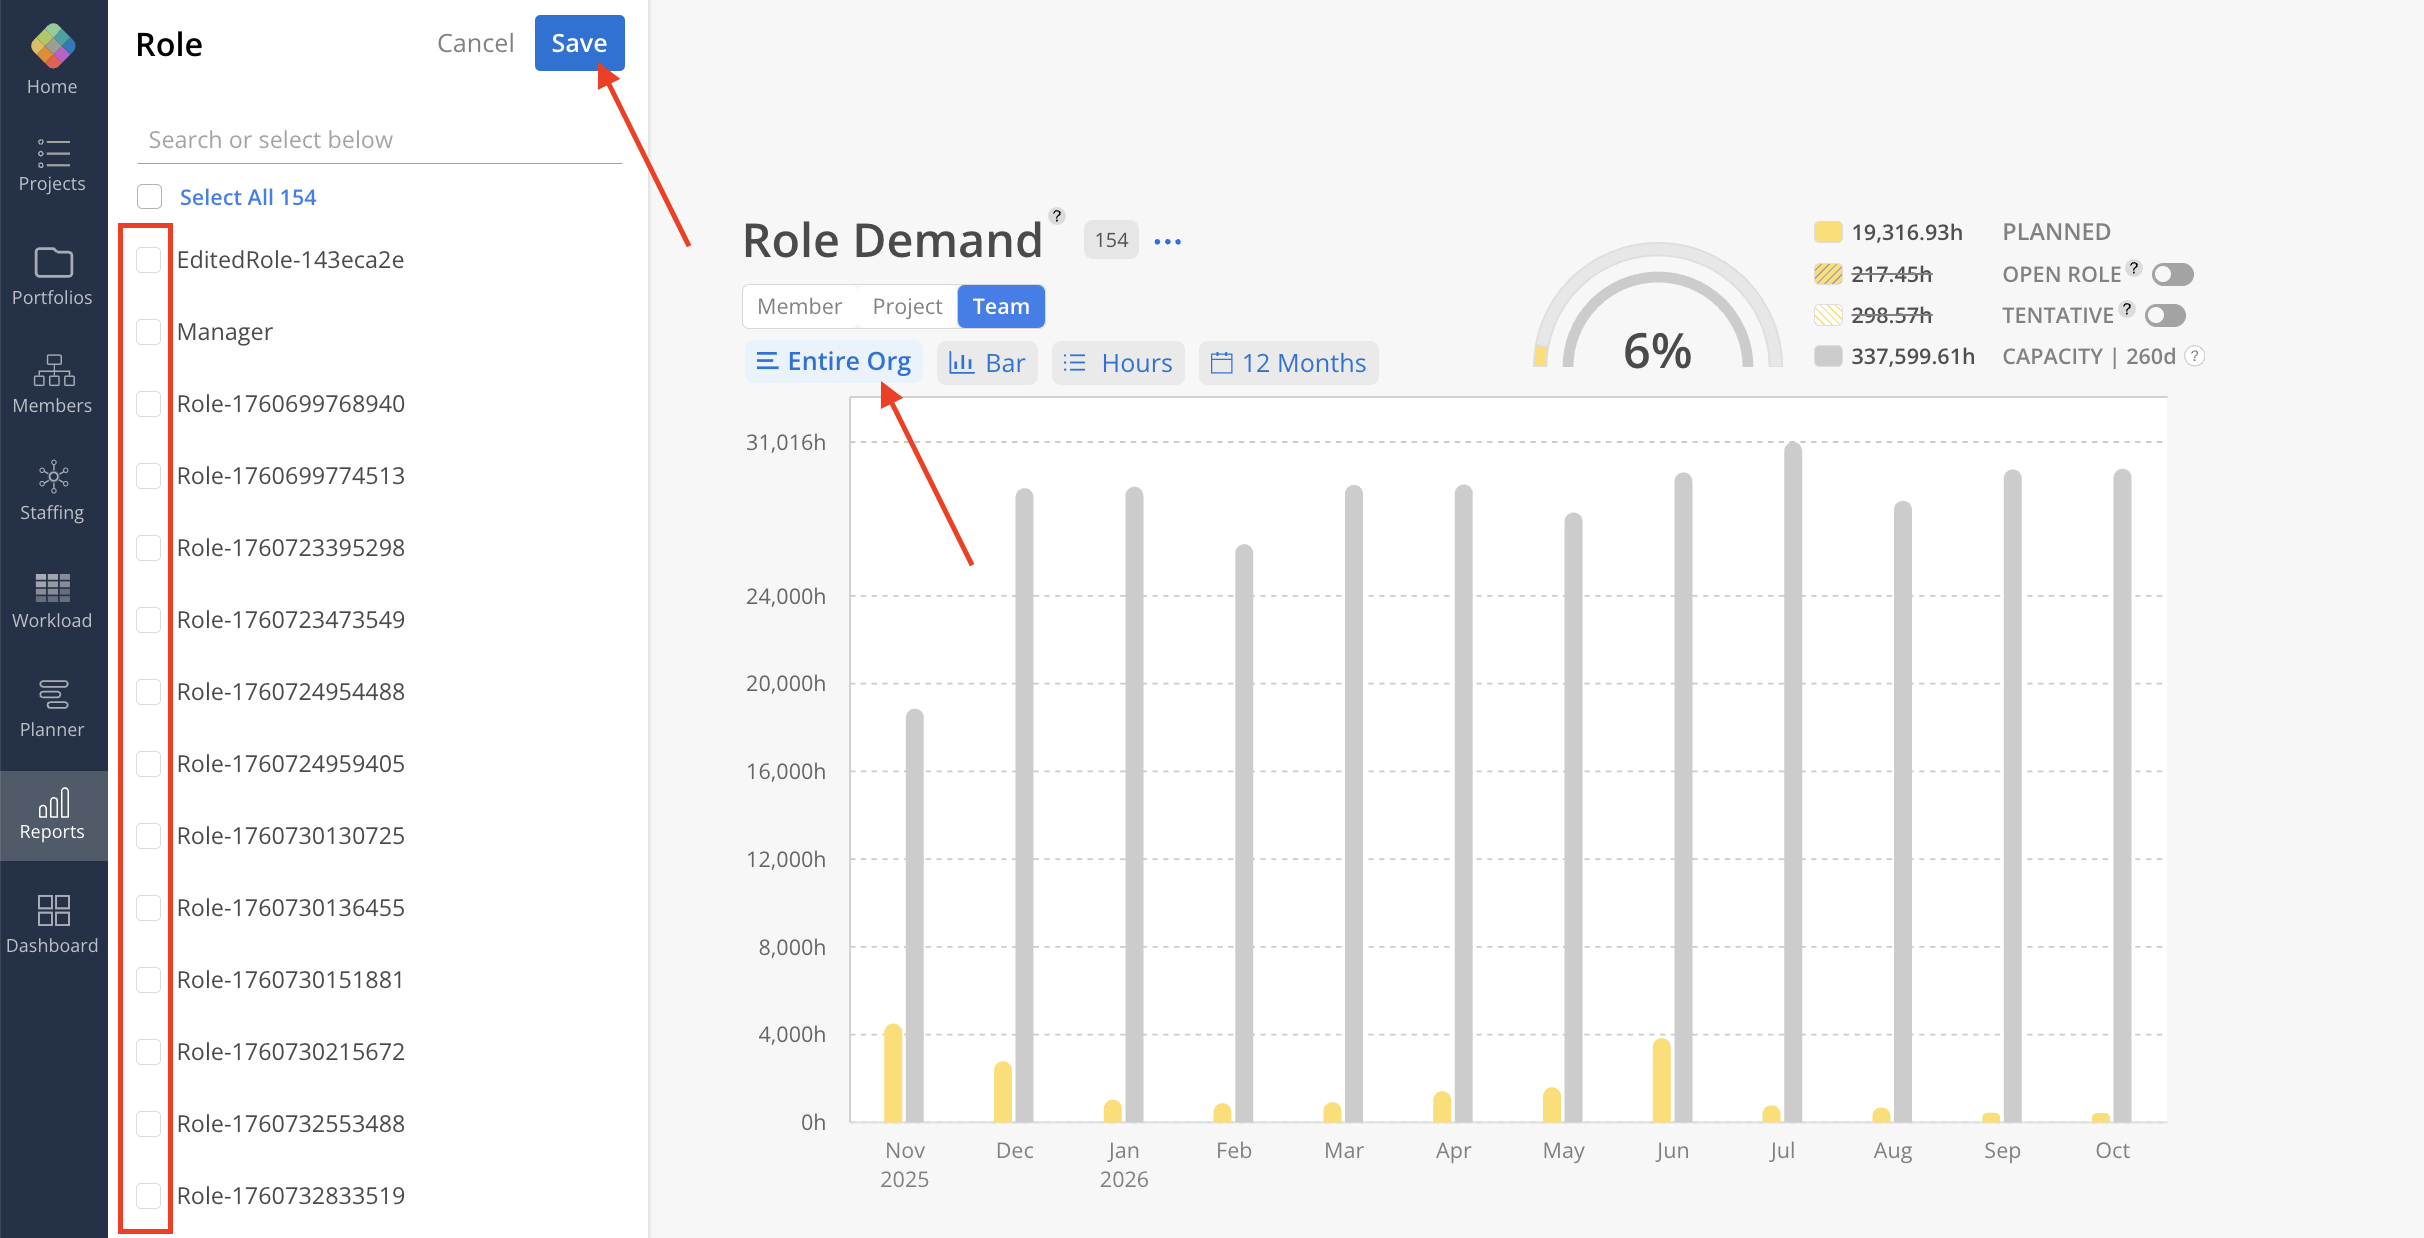
Select the role(s) you would like to view by clicking Select Roles. Use the checkbox to select Role, then click Save after selecting the roles. Click +Add Role at the bottom to add new standard roles in organization settings (only admin can do this).
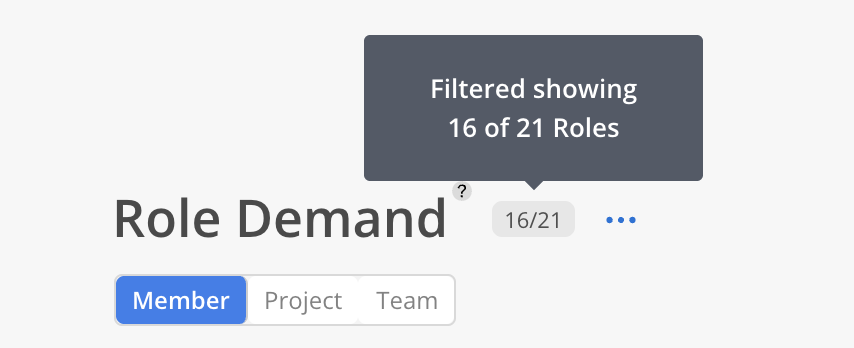
Next to the Report title, the number of filtered Open Roles is displayed alongside the total count.
Along with the Selected Role you would see:
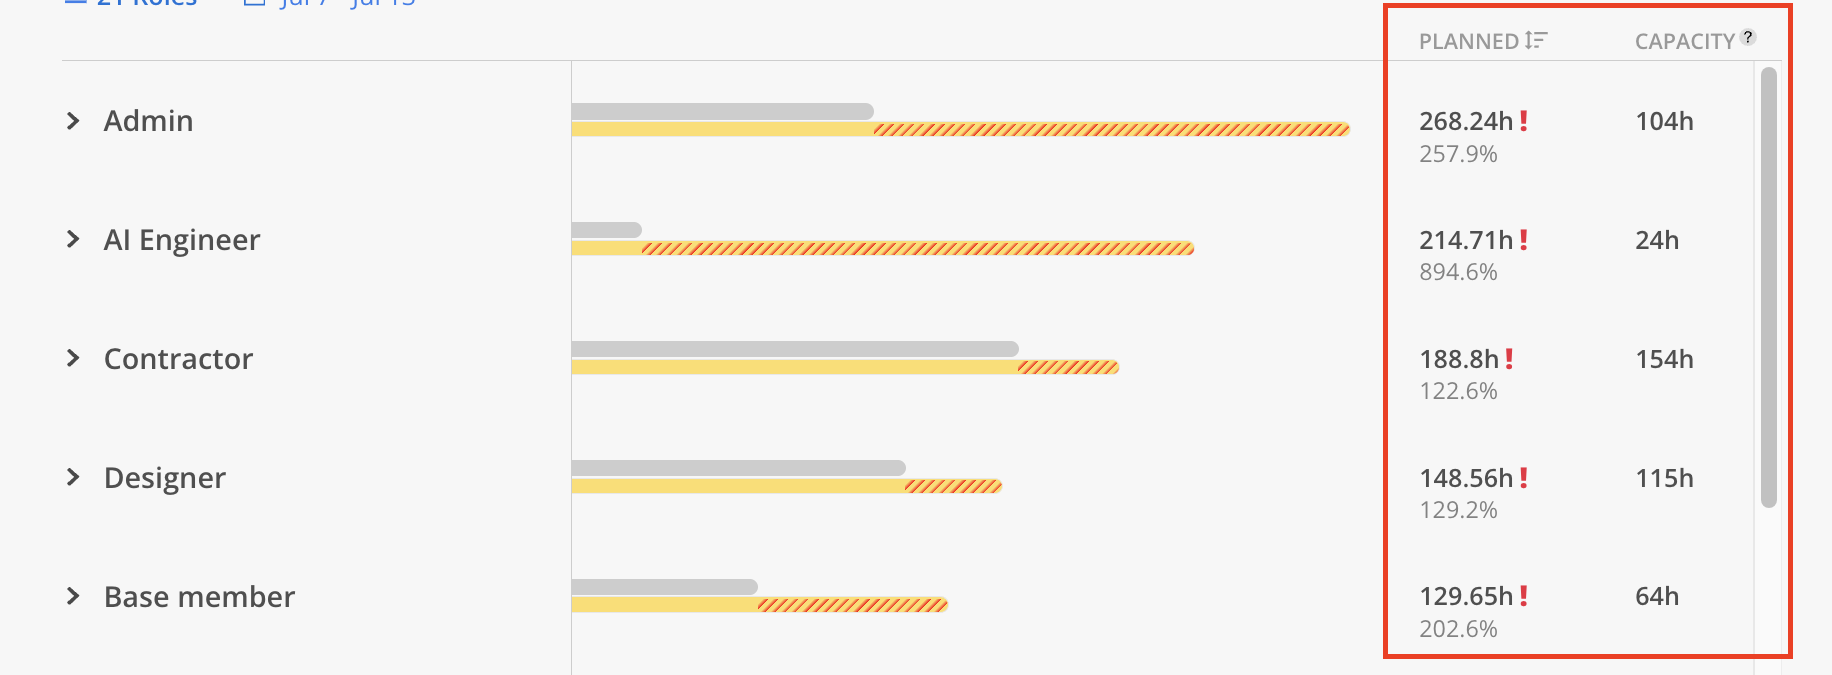
The yellow line = planned time for named resources + placeholder resources.
The grey line = that role's capacity to take on that work.
Expand the Role to display all Members assigned to it, along with their contributions to the Role’s overall Capacity.
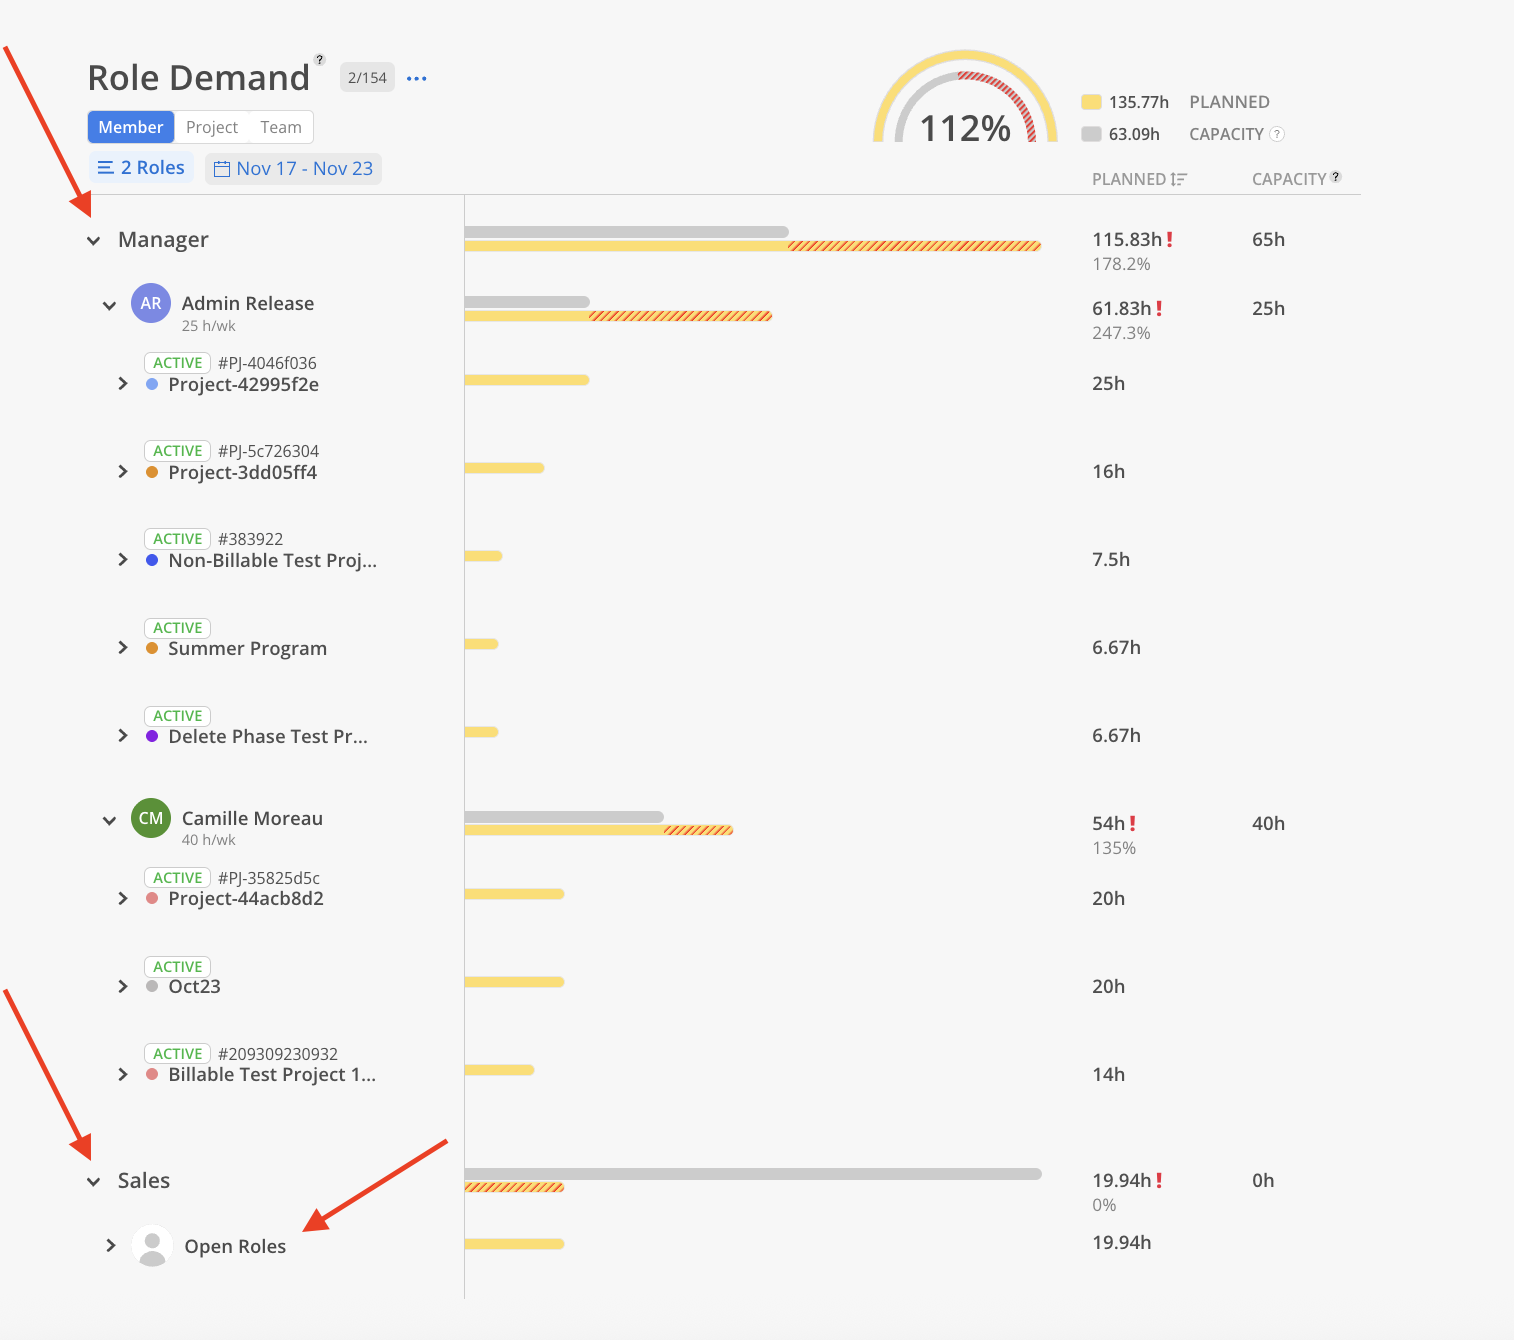
The hours on the left show total hours planned for that role and hours on the right show total hours available for that role.
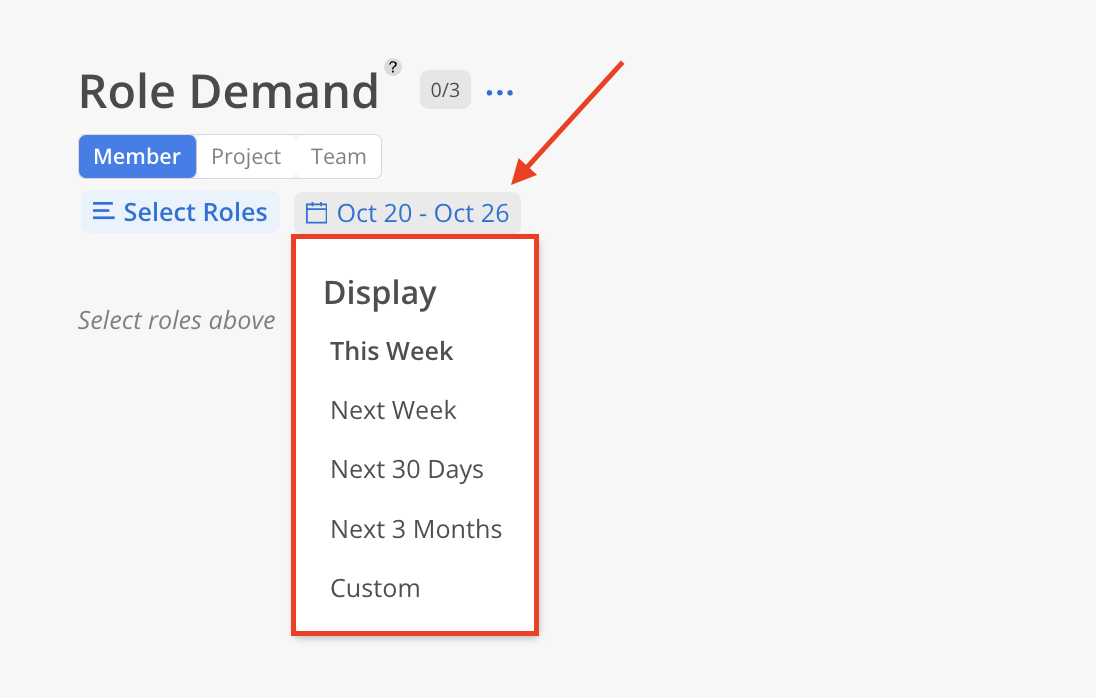
Click the dates on the top to change the time frame of the report.
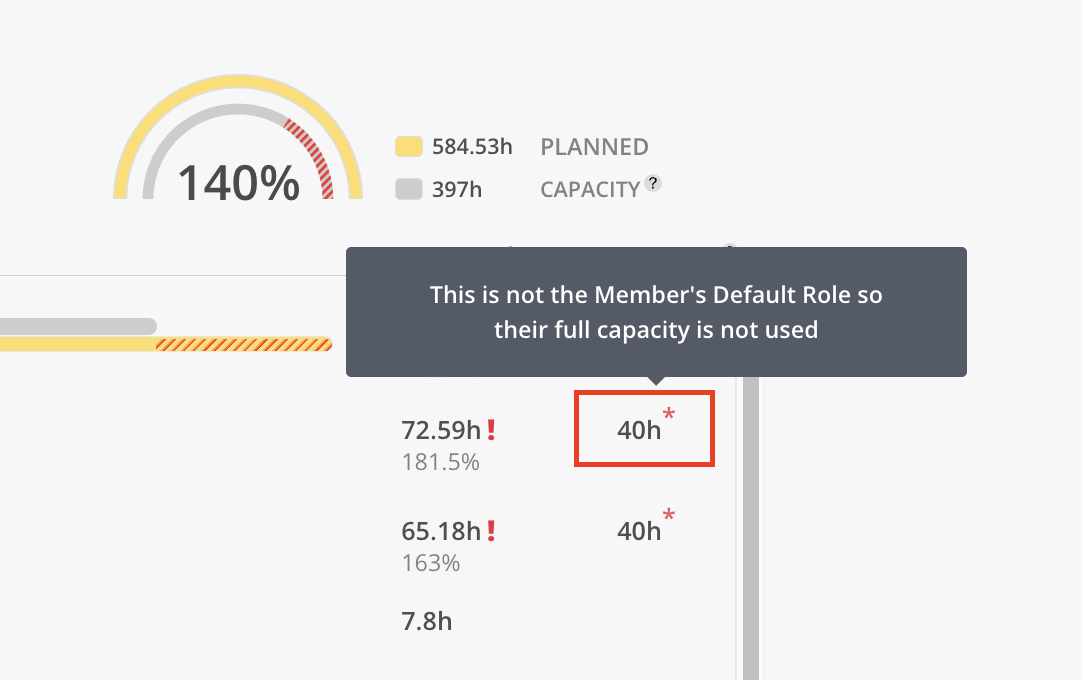
An asterisk (*) appears next to a Member's Capacity value when the Role assigned in the Project differs from their Default Role on the team.
On the top right you will the overarching hours for the roles you currently have selected.

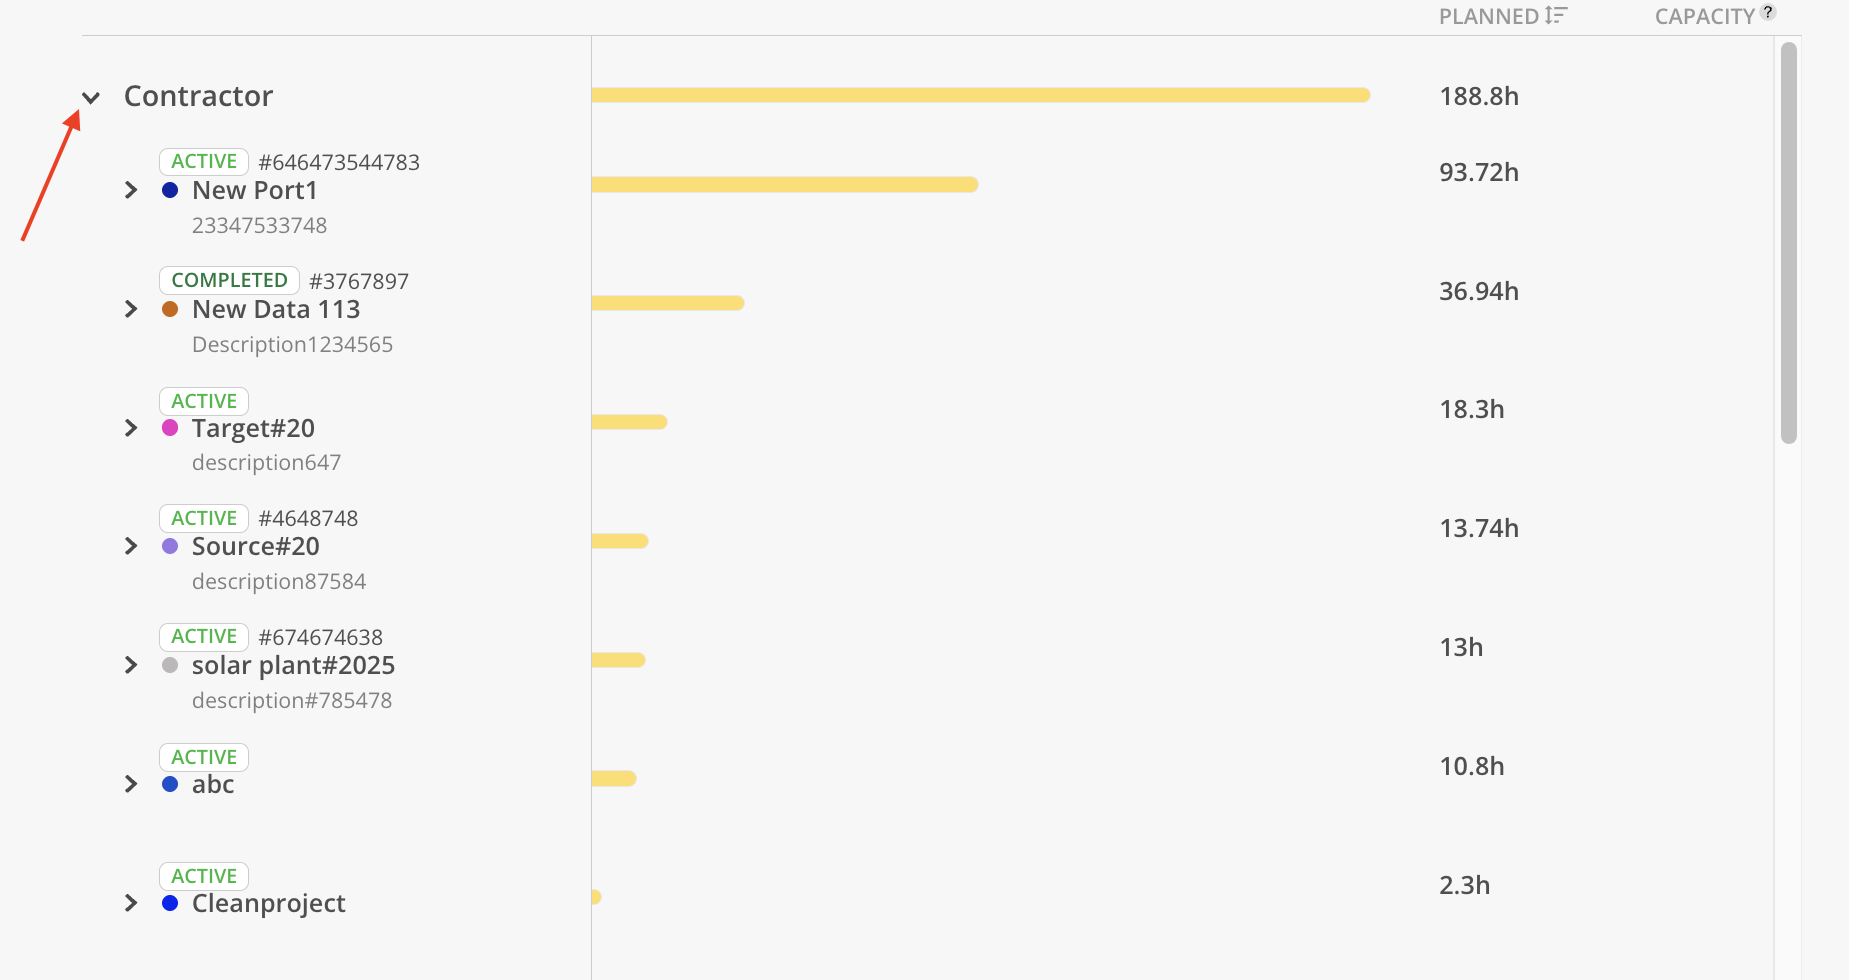
Project tab of the report allows you to view which projects are making up those planned hours for a given role.

You can expand each role to see the projects that have planned hours contributing to the role's total planned hours.
On Member and Project tab, Work Planners with the following permissions:
Work Planner > Can Edit > Projects they are a member of
Work Planner > Can Edit > Projects they are a Project Manager of
can only view projects they have access to (either as a member or as a Project Manager).
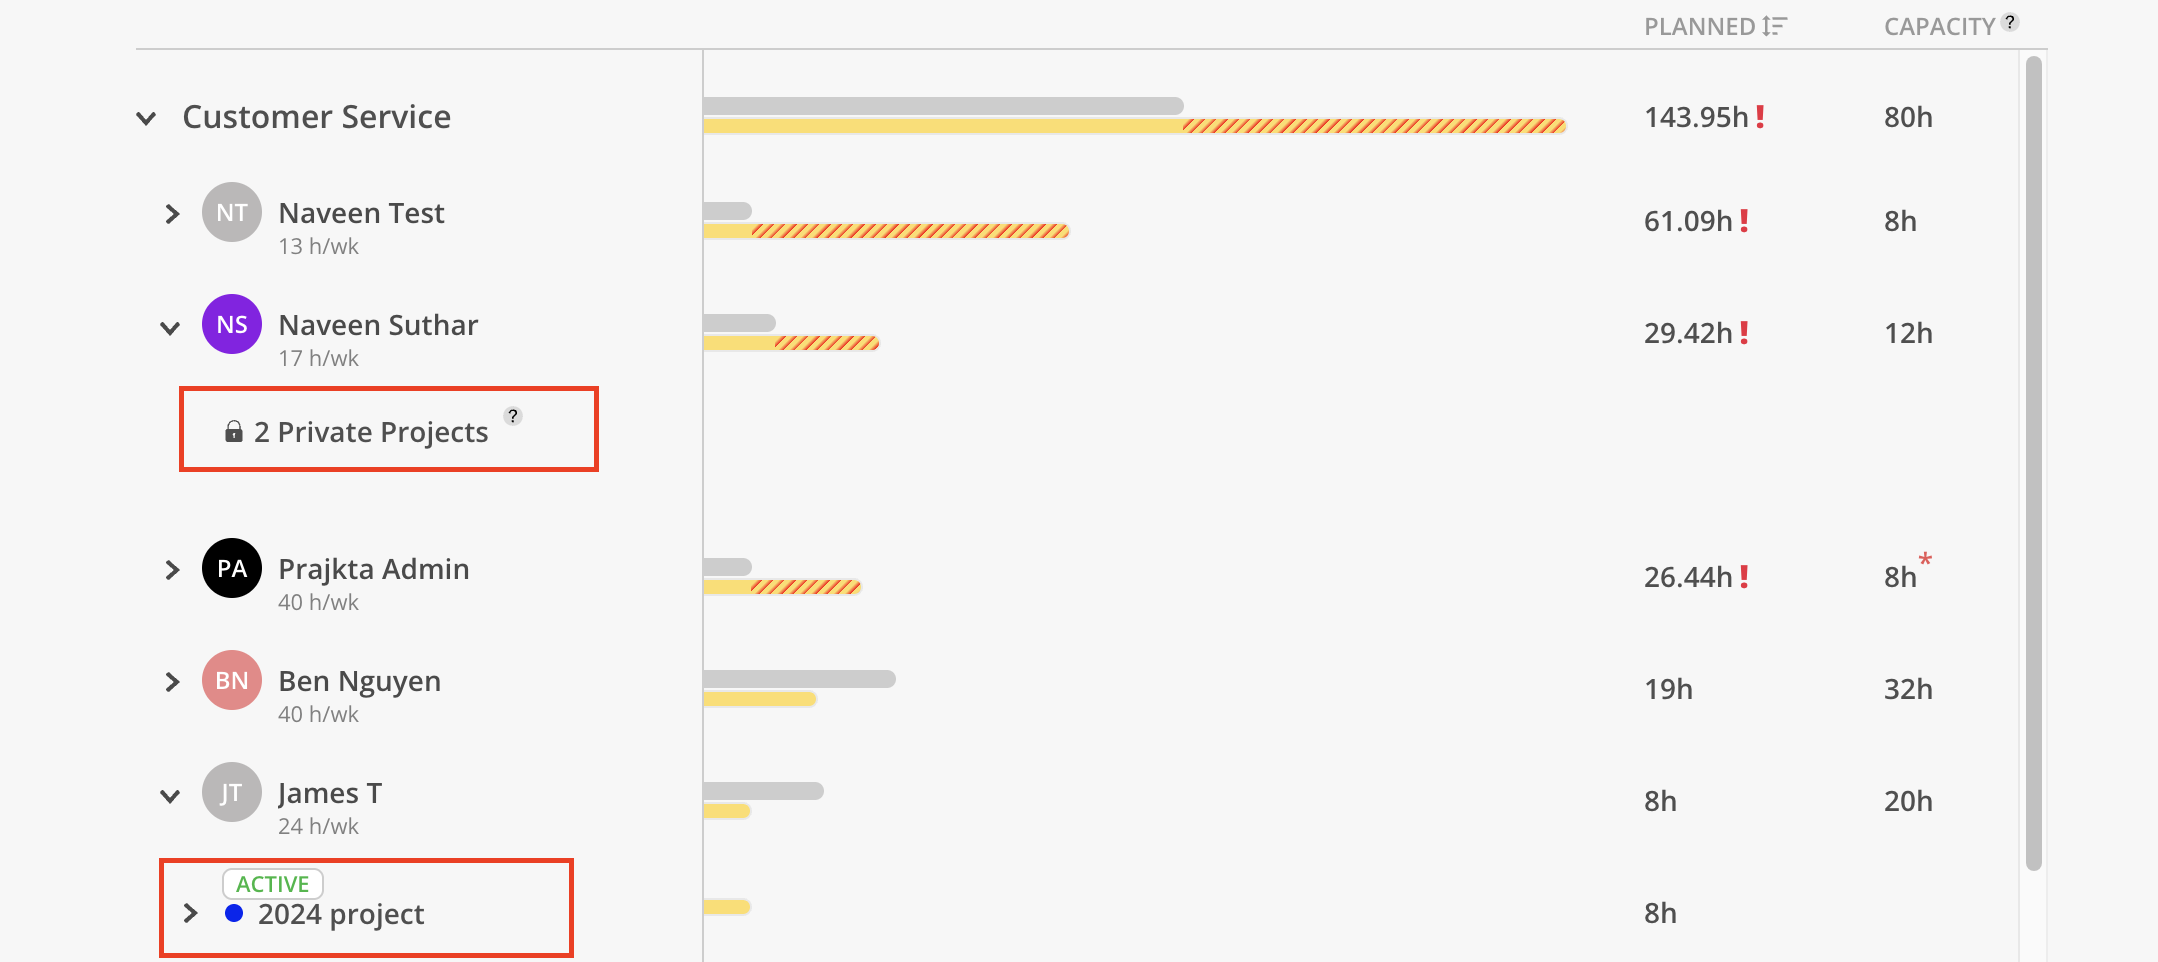
Provides you with a visual overview of the demand all roles (or selected roles) have over a period of time.
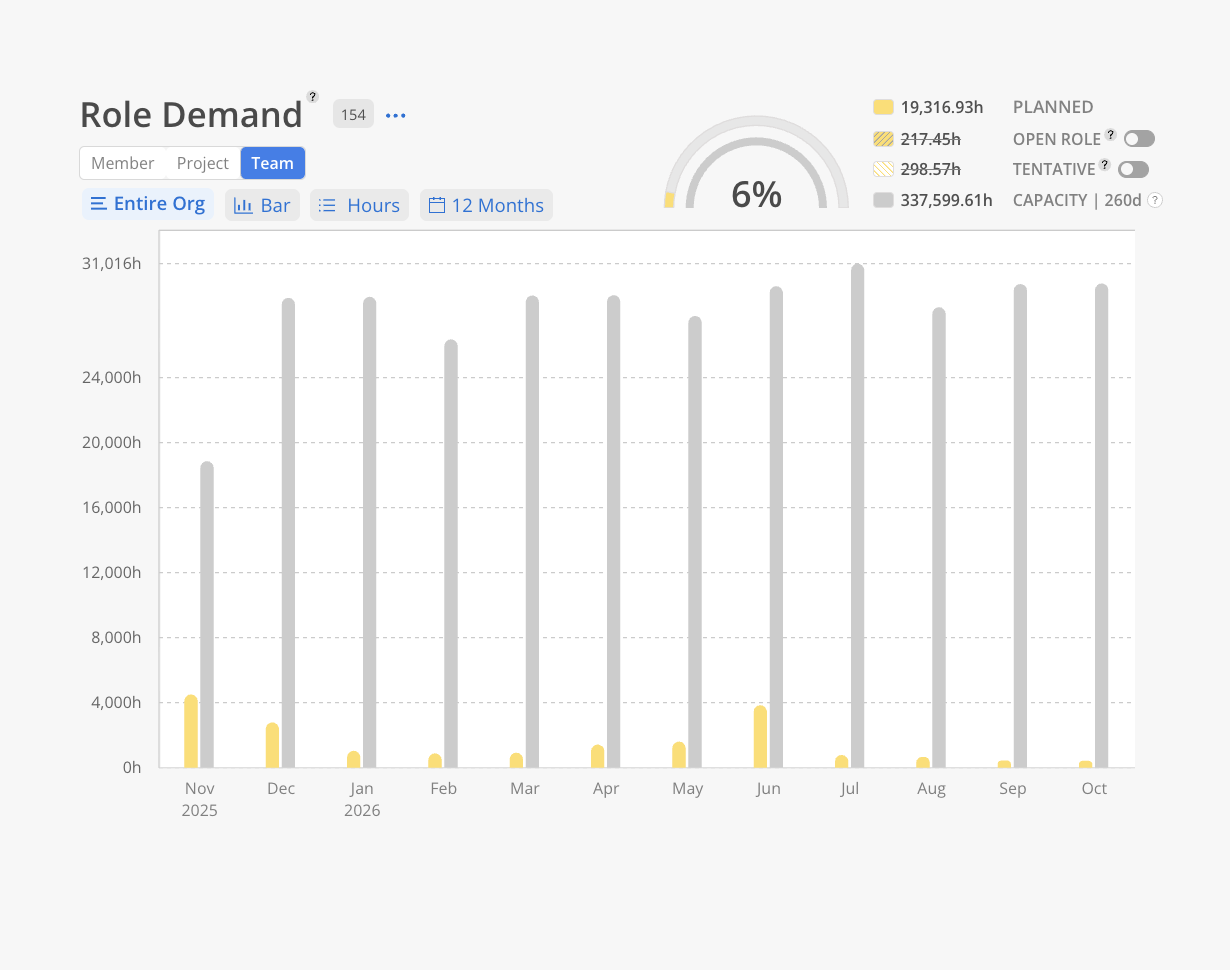
On the top, a summary is displayed:
Percentage – Displayed as a percentage, this represents the ratio of total Planned hours to overall
Planned – Shown in yellow, this represents the total Work Plan hours for all Roles in the organization or for selected Roles.
Open Role – Toggles the display of Work Plans assigned to Generic Resources. Open Role hours are tentative by default and are not included in the Tentative hours for the purpose of this report.
Tentative – Toggles the display of tentative Work Plans assigned to actual Roles. This excludes all Open Role hours..
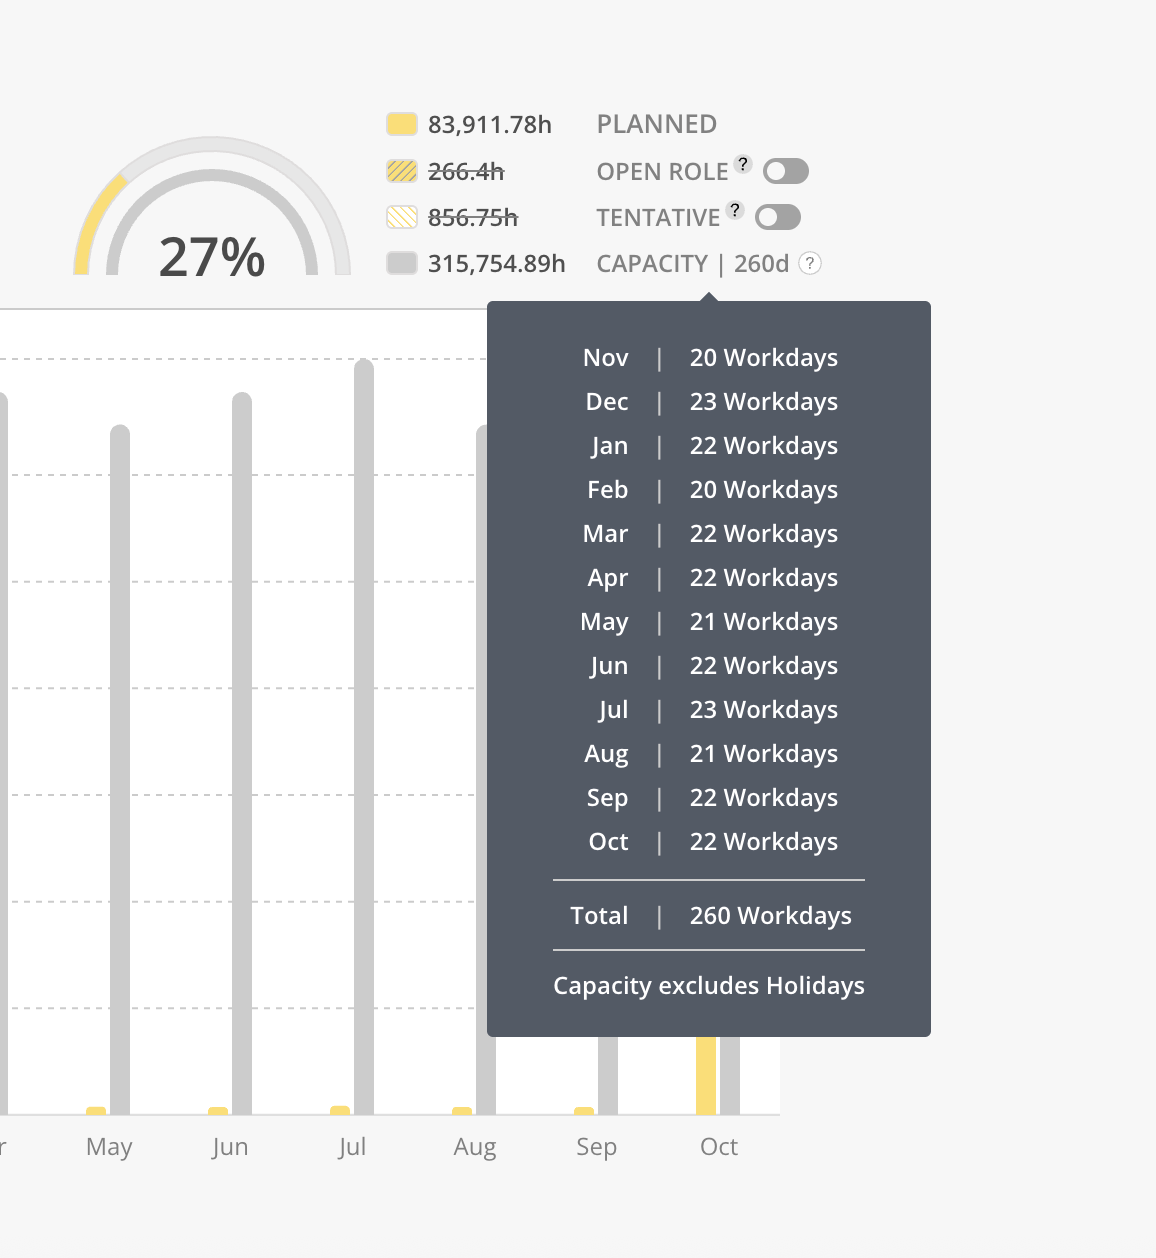
Capacity – Displays the total Capacity for all Roles in the organization or for selected Roles, excluding holidays.

This tab defaults to displaying data for all roles in the organization, with an option to filter and view specific roles of interest.
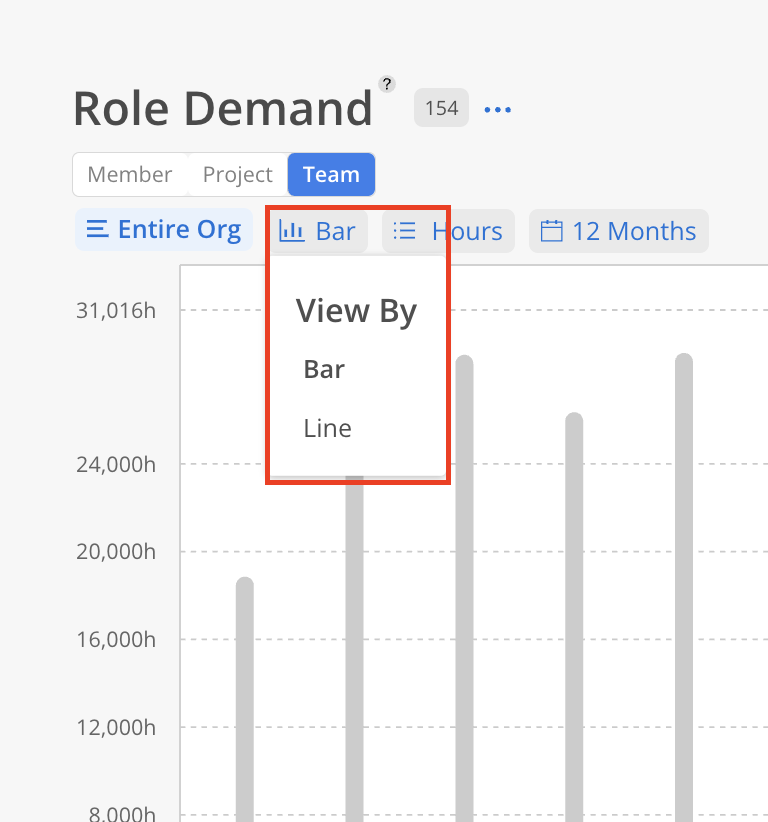
Click the button next to the select role button to view the data in bar chart or graph.
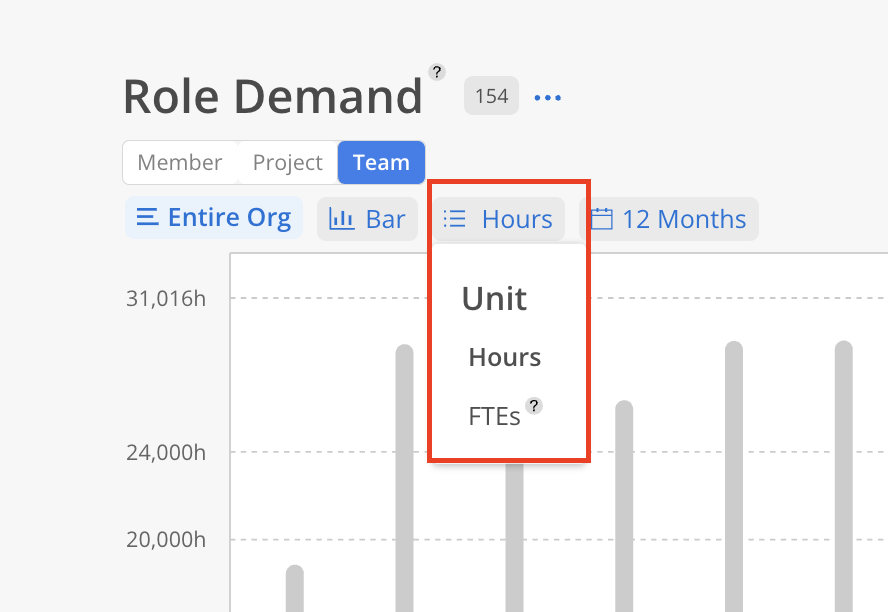
Data can be viewed by hours or FTE (full-time equivalent) headcount. The FTE headcount displays demand in terms of the number of employees required to manage the current workload.
Use the date filter to view Demand for the next 12 weeks or the next 12 months, ensuring if you need to hire that you have a sustained need for that new hire, or see when demand peaks.
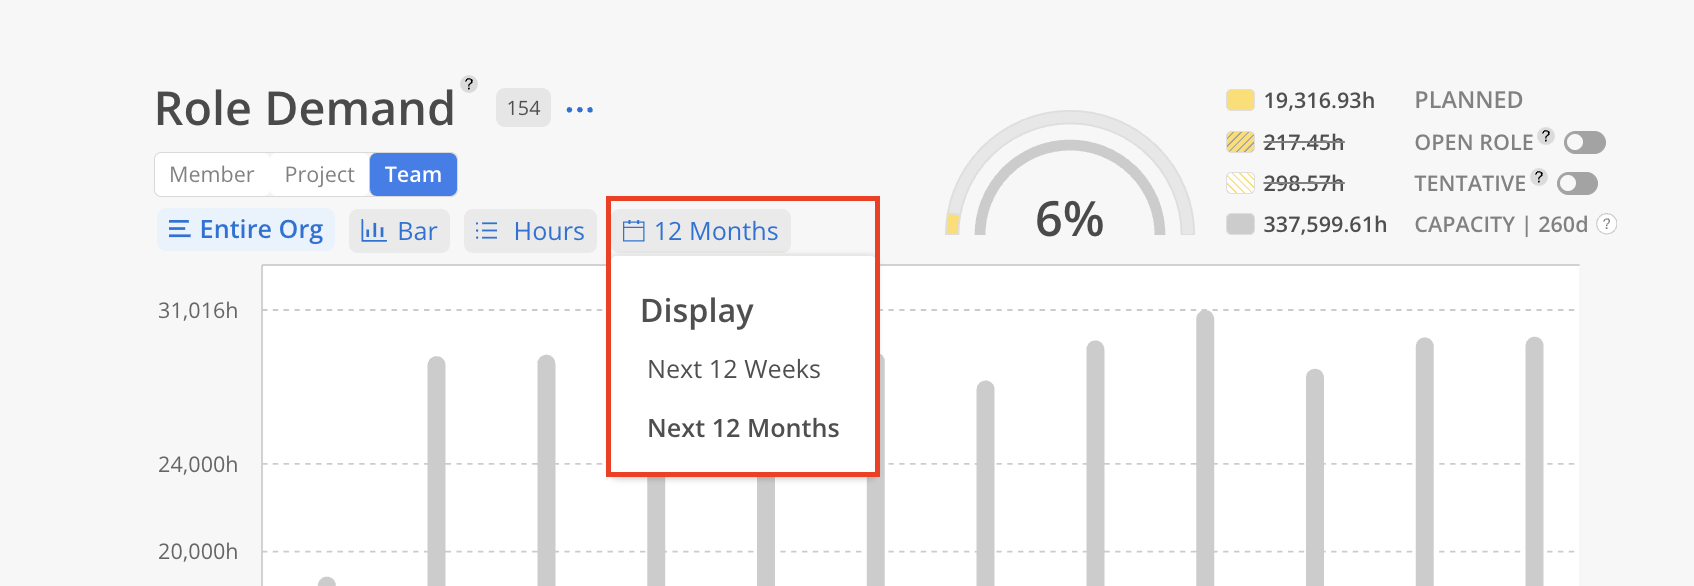
On Team tab, the number of total workdays will show next to the CAPACITY row on the summary chart
When select Next 12 Months date range, hover on the CAPACITY row to see the breakdown of total workdays per months
